
PYPL
#360
PayPal Holdings, Inc. - Common Stock
47.6 5 USD
+0.03%
Sector: Financial
Base: USD
Profit Currency: USD
Daily Range
Year Range
Daily Change
+2.87%
Monthly Change
+12.49%
6 month change
-17.47%
Year Change
-35.43%
Previous Close
46.3 2
Open
47.6 5
Low
47.6 5
High
47.6 5
Volume
399
Financials
Value 202020212022202320242025 Current
Key stats
Valuation ratios
Profitability ratios
Liquidity ratios
Solvency ratios
Per share metrics
News
How To Build A $50,000 Dividend Portfolio In Today's Market
6% APY, Unlimited 3% Cash Back and Free ATM Withdrawals: Everything You Need to Know About Elon Musk's 'Bank Killer' X Money App
Can Toast Keep Serving Gains? Buy, Sell or Hold TOST Stock Now?
Is PYPL Stock Worth Retaining in Your Portfolio for the Long Run?
Can SEZL's Rally Keep Running Higher? Is it Time to Buy the Stock?
PayPal Stock (PYPL) Ticks Up as PYUSD Goes Native on Polygon - TipRanks.com
This is why paper checks refuse to die
PayPal seeks to increase use of PYUSD stablecoin with native issuance on Polygon
Stocks Weighed Down by Geopolitical Risks
PayPal AI Push: Will $1.5B Savings Drive Faster Growth Ahead?
Stocks Retreat on US-Iran Jitters
Charts & Ideas
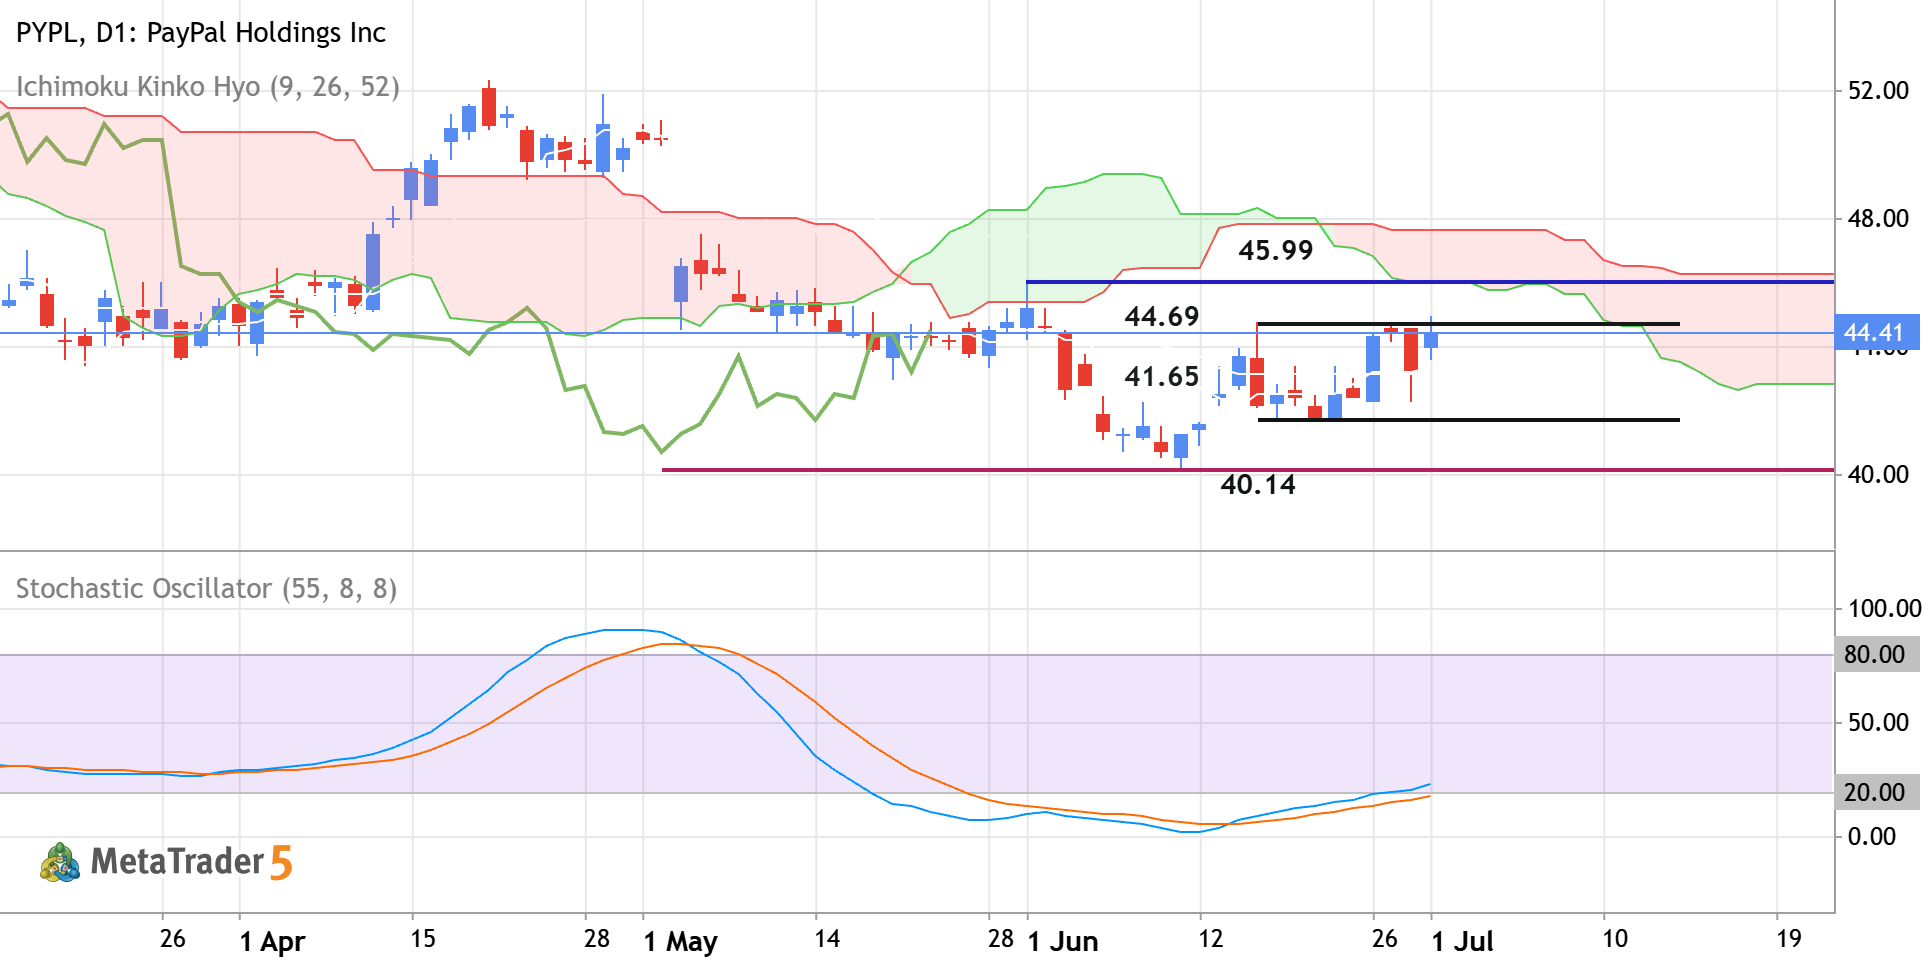
PYPL - Daily Rally to the Possible Bullish Reversal
Daily price is located near and below Ichimoku cloud in the bearish area of the chart. The price was blinced from resistance levels at 40.14 and 41.65 to above for the bear market rally to be started. The Stochastic oscillator is showing the possible uptrend in the near future, and Chinkou Span line is crossing historical price but on open daily bar for now. If the price breaks the resistance level at 44.69 to the 45.99 to above so the primary bullish reversal will be started. If the price crosses support at 41.65 together with support level at 40.14 to below so the primary bearish trend will be resumed. Alternatively, the price will be on secondary ranging within the primary bearish trend to be near and below Ichimoku cloud waiting for direction of the strong trend to be started. Trading
0 

The PYPL doesn’t have other trading ideas at this time
Browse ready-made trading ideas or select a symbol and create your own
Go to Charts and Trading Ideas