XAGUSD (Silver) M15 Setup: Major Resistance Reject & Bullish Order Block Target Zone XAGUSD Short Silver vs US Dollar

XAGUSD (Silver) M15 Setup: Major Resistance Reject & Bullish Order Block Target Zone

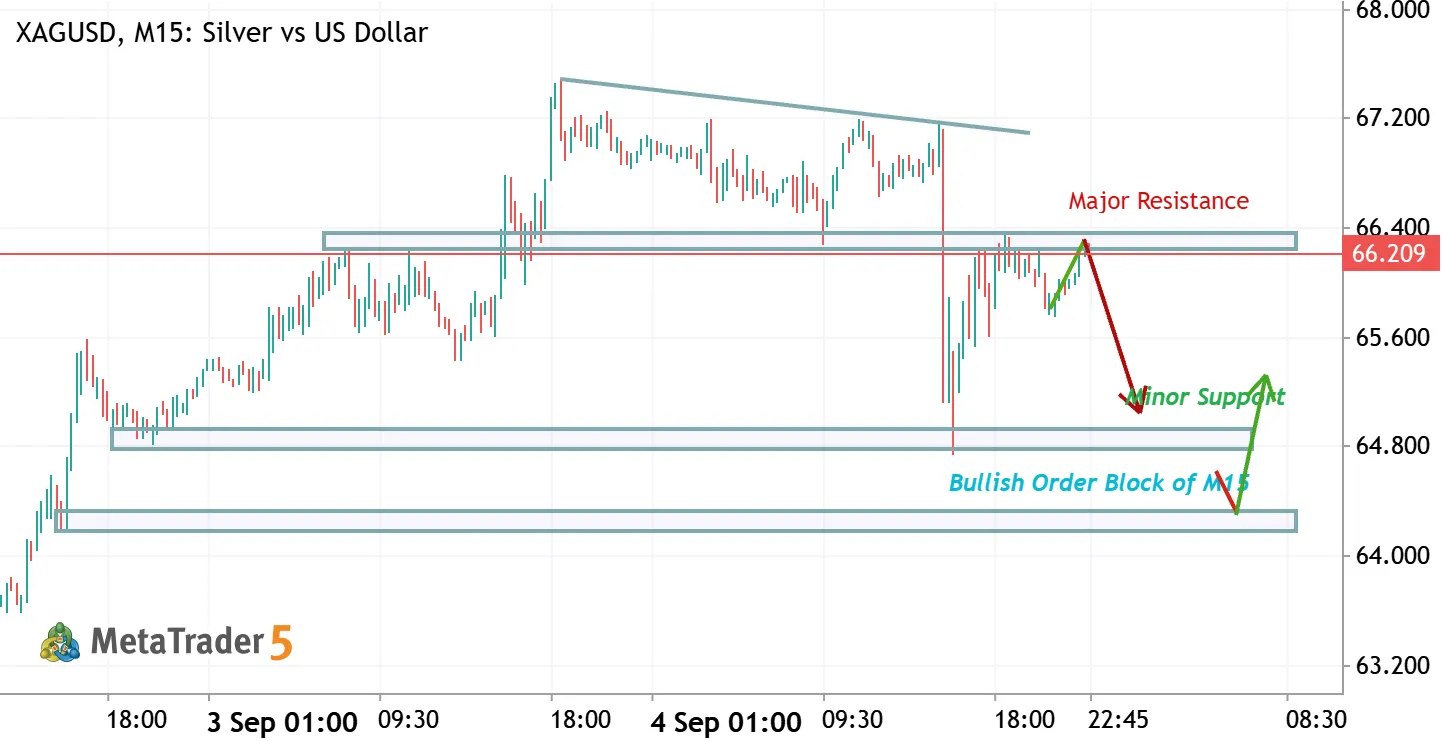
Hey everyone, Taking a look at XAGUSD on the M15 timeframe today. We’re seeing a clean structural setup unfold after a liquidity sweep and rapid drop. Current Market Dynamics: Major Resistance ($66.20 - $66.40): Price bounced back to retest the prior support-turned-resistance zone after the sharp decline from the $67.30 highs. Short-Term Bearish Outlook: Rejection at $66.20 opens up a drop toward Minor Support around $65.00 . Bullish Order Block Target ($64.25 - $64.40): The primary demand zone lies lower. If price sweeps into this M15 Bullish Order Block, look for buyer absorption and a potential reversal setup to trigger long trades. Algorithmic Trading / EA Logic Notes: If you are coding an Expert Advisor (EA) or script for this structure: Filter Rule: Require an M15 candle close below

BTC/USD Hourly Technical Update: Reclaiming the 79.6k Support Zone for a Push Toward 82.4k BTCUSD Long Bitcoin vs US Dollar

BTC/USD Hourly Technical Update: Reclaiming the 79.6k Support Zone for a Push Toward 82.4k

Bitcoin is showing strong signs of stabilization after a quick liquidity sweep following its recent rally. Here is a breakdown of what the 1-hour chart is telling us right now: Technical Breakdown Trendline Break & Impulsive Expansion: Bitcoin broke out of its initial downward trendline around the $77,000 level, driving a strong impulsive move up to test resistance near $81,600–$82,000. Flag Consolidation & Liquidity Grab: Following that strong move up, price consolidated into a classic bullish flag/channel structure. After a sharp dip swept recent low-liquidity areas down to roughly $78,500, price aggressively bounced back into the demand range. Key Support Level: The price is currently hovering around $79,656 , right at a major horizontal flip zone that previously acted as
XAUUSD (Gold) H1 Technical Analysis XAUUSD Short Gold vs US Dollar

XAUUSD (Gold) H1 Technical Analysis

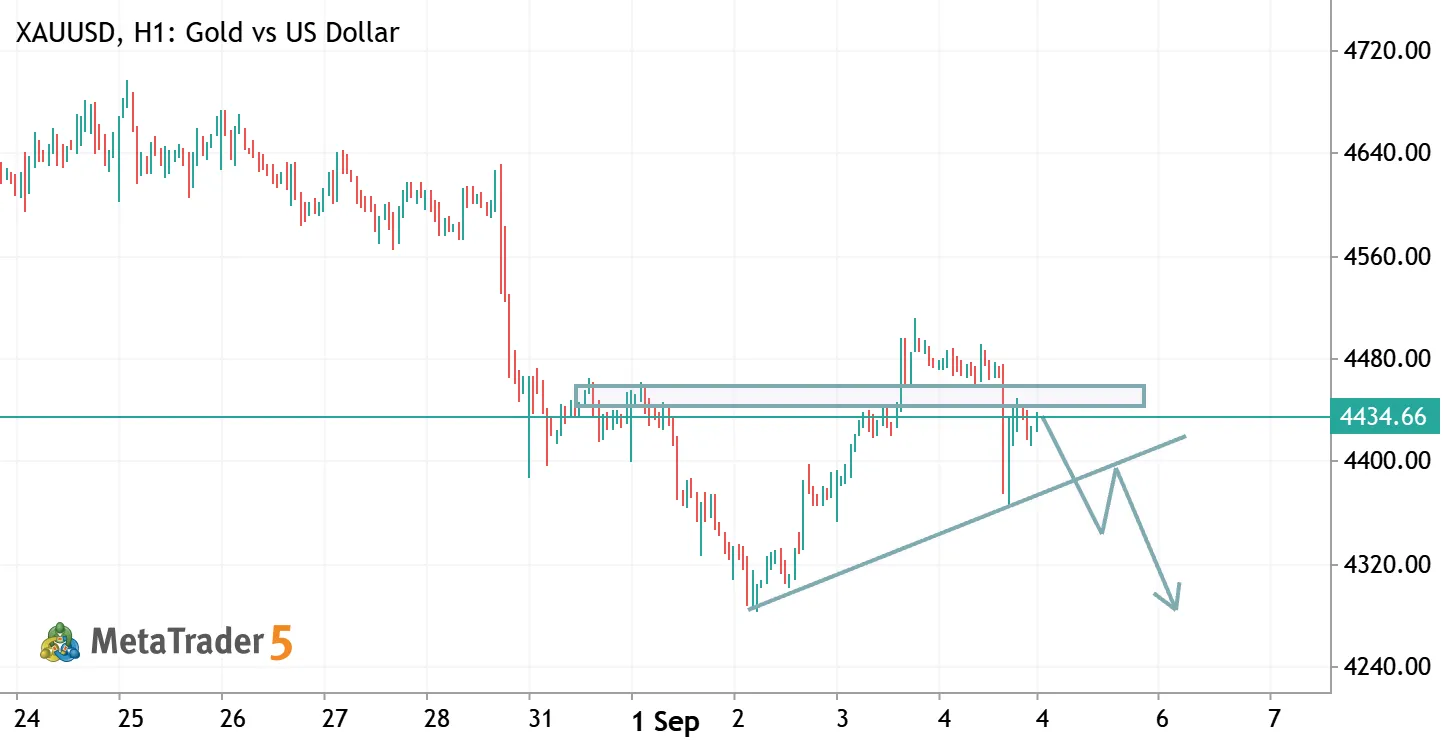
XAUUSD (Gold) H1 Technical Analysis The H1 chart of Gold against the US Dollar shows a bearish structural breakdown following a rejection from the key resistance zone. After a sharp sell-off from the 4600.00–4700.00 region, price consolidated before breaking above the horizontal supply zone near 4450.00–4460.00 to sweep liquidity. However, price failed to sustain higher levels and aggressively dropped back below the 4450.00 resistance level (currently trading around 4434.66). The visual forecast illustrates a potential retest of the ascending trendline/support zone, followed by a pullback retest of the broken trendline, before continuing the downward movement toward the major demand level near 4300.00. Hypothetical Signal Idea (Educational Setup) Direction: Sell / Short Entry Zone: 4430.00
XAU/USD (Gold) Sell Setup – Bearish Momentum Zone XAUUSD Short Gold vs US Dollar

XAU/USD (Gold) Sell Setup – Bearish Momentum Zone

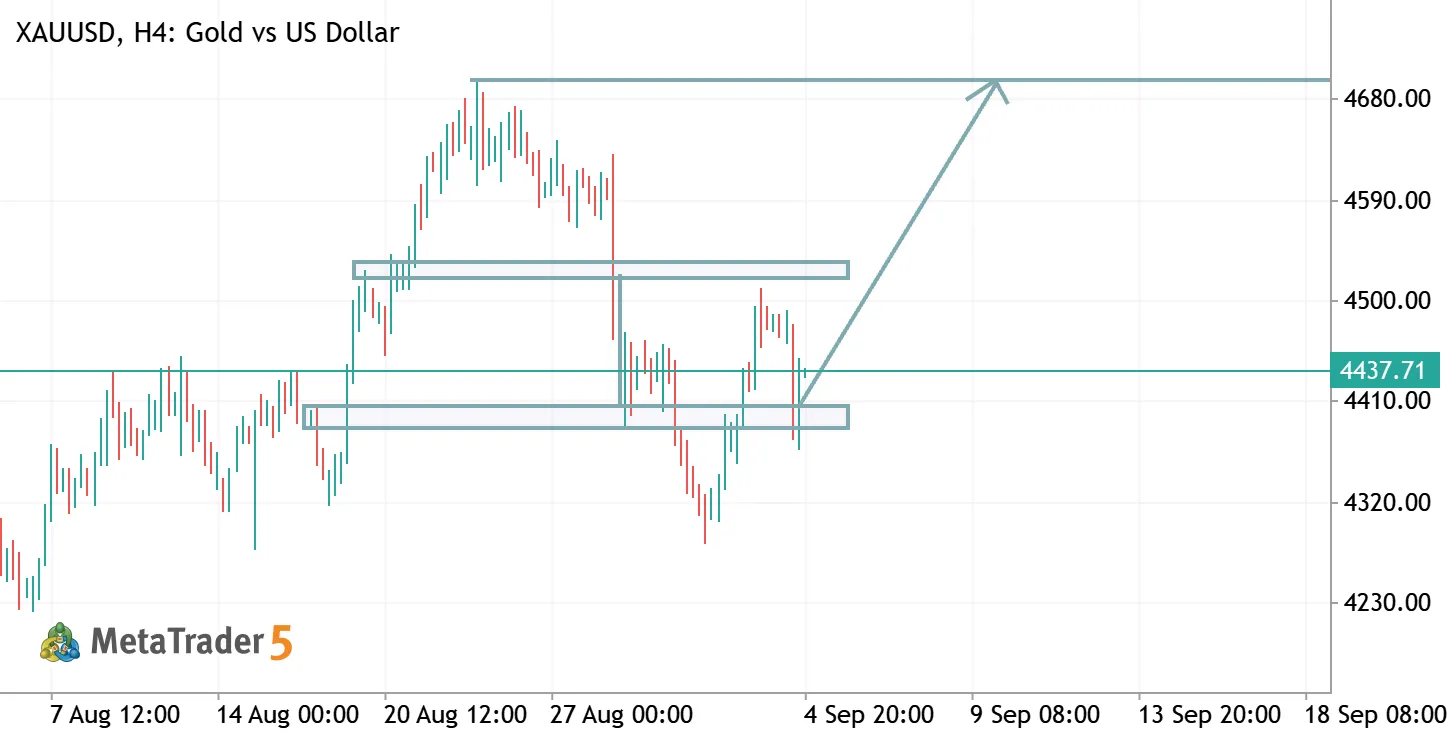
Sell Zone: 4494 – 4504 🛑 Stop Loss: 4515 🎯 Take Profit: • TP1: 4485 • TP2: 4470 • TP3: 4450 Gold is approaching the 4494–4504 selling zone, where bearish pressure could develop. If price remains below this area, the setup may target 4485 first, followed by 4470 and the extended target at 4450. 📌 Trade Management: After TP1 is reached, consider securing partial profits and managing the remaining position toward TP2 and TP3. Adjust risk according to your account size and trading plan. ⚠️ Risk Disclaimer: This is a technical analysis setup, not a guarantee of profit. Always use proper risk management and trade according to your own strategy.
XAU/USD (Gold) Sell Setup – Bearish Zone XAUUSD Short Gold vs US Dollar

XAU/USD (Gold) Sell Setup – Bearish Zone

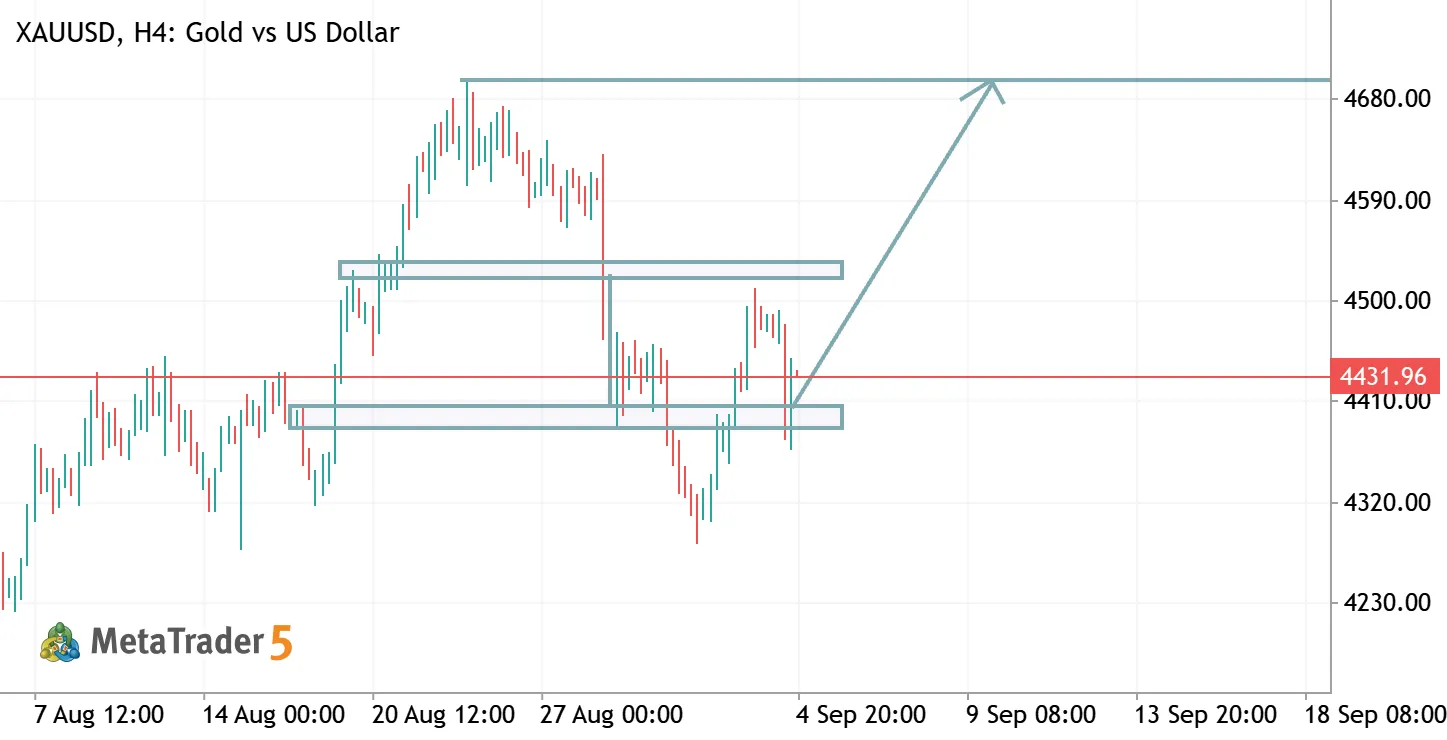
📉 Sell Zone: 4440 – 4450 🛑 Stop Loss: 4460 🎯 Take Profit: • TP1: 4430 • TP2: 4410 • Long TP: 4390 & Open Gold is approaching a key selling zone where bearish pressure could develop. If price holds below the 4440–4450 area, the setup may target 4430 first, followed by 4410 and the extended target at 4390 & Open. 📌 Trade Management: After TP1 is reached, consider securing partial profits and managing the remaining position toward TP2 and the long TP. Adjust risk according to your account size and trading plan. ⚠️ Risk Disclaimer: This is a technical analysis setup, not a guarantee of profit. Always use proper risk management and trade according to your own strategy.
EURUSD M30 – Bearish Setup from Resistance EURUSD Short Euro vs US Dollar

EURUSD M30 – Bearish Setup from Resistance

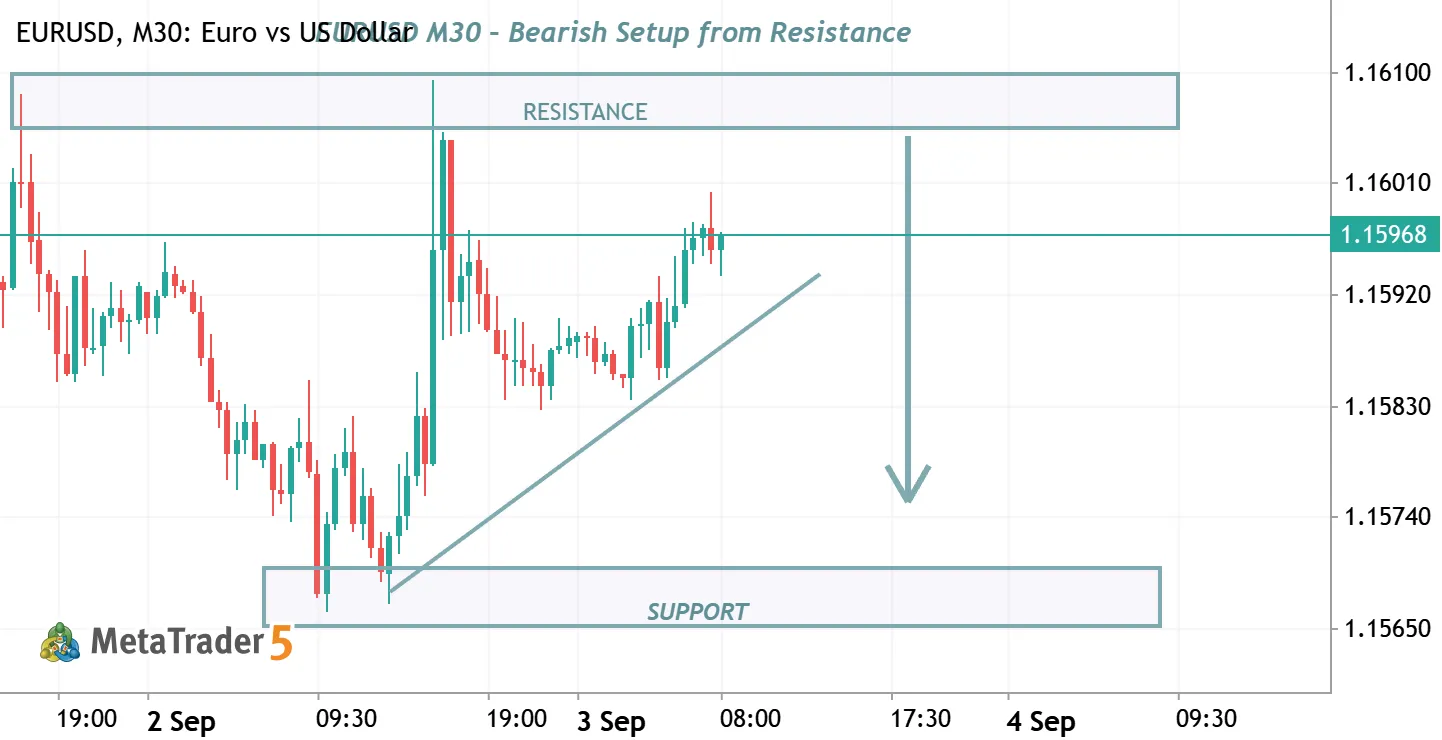
EURUSD is currently trading near an important resistance zone , where price may face selling pressure and rejection. The M30 chart shows a recovery from the marked support area , but the current upward movement is approaching a key resistance level. A confirmed rejection from this zone could create a potential bearish opportunity toward the lower support area. 🔹 Instrument: EURUSD 🔹 Timeframe: M30 🔹 Market Bias: Bearish below resistance 🔹 Key Resistance: 1.1605–1.1610 area 🔹 Potential Target: 1.1570 support zone ⚠️ Risk Management: Always wait for proper confirmation before entering a trade and use appropriate stop-loss and money management. 📈 Follow THE QZI TRADER for more professional market analysis, trading signals, and copy trading updates.