Gold Reversal Roadmap XAUUSD Long Gold vs US Dollar

Gold Reversal Roadmap

Gold ran hard from about 4000 in late July to a peak near 4690 on Aug 25. Since that top, every rally has failed a little lower than the last — that's the downward-sloping line drawn from the high. Meanwhile the lows around 4280–4300 (mid-August and the Sep 1–3 dip) have held, forming the flat-ish line underneath. Price is now squeezed into the narrowing gap between them, which is why the last two weeks look choppy and directionless. R oadmap: One more leg down. Price slides along under the falling resistance line and drops into the 4280–4300 support zone, roughly mid-September. Notice the up-arrow actually starts below the support line, near 4260 — so the idea allows for a brief dip through support (a stop-run) before it turns. First bounce. A recovery to around 4450, then a pullback to
AMZN: $252 support and a $261 breakout trigger AMZN Amazon.com Inc

AMZN: $252 support and a $261 breakout trigger

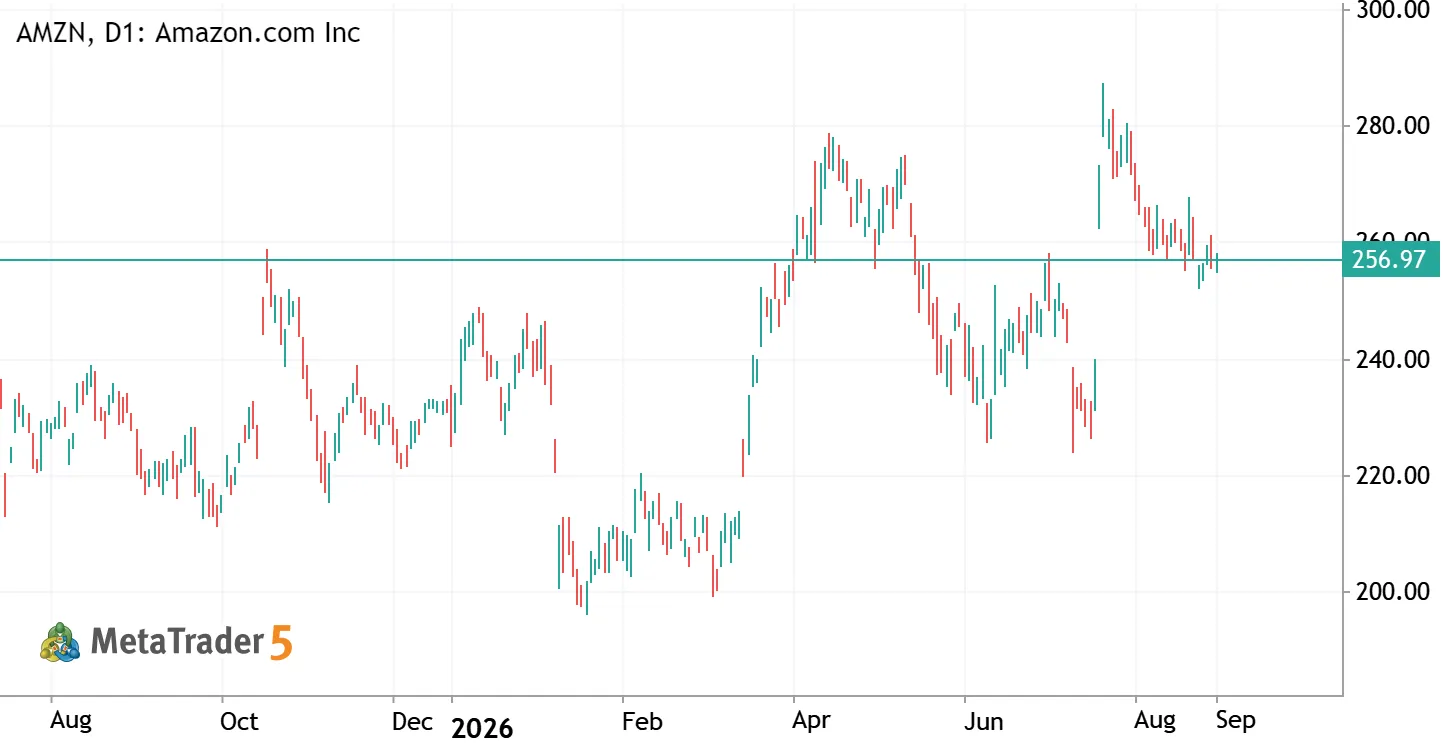
Amazon (NASDAQ: AMZN) | Daily chart | September 9, 2026 View: neutral while the base develops; bullish only after confirmation. Horizon: 2–6 weeks. The latest completed regular session, September 8, closed at $256.97, down 0.60%. This analysis uses that close. Price structure The daily chart shows a pullback from the July peak, with price now testing a potential base. Support sits at $254.75 (September 8 low), followed by $253.40 and $251.93 (September 2 and September 1 lows). Resistance is $259.50–261.12, then $264.36 and $267.56, the August 31 and August 28 highs. These are areas to watch, not guaranteed turning points. Preferred bullish setup Wait for a daily close above $261.20, ideally on volume above its 20-session average, then a successful retest of $260.50–261.50. A retest that
XTIUSD (Crude Oil) – 95.5 Sell Setup XTIUSD Short Crude Oil vs US Dollar

XTIUSD (Crude Oil) – 95.5 Sell Setup

📉 Sell Zone: 95.5 – 95.8 🛑 Stop Loss: 96.0 🎯 Target: • TP1: 93.0 📈 Market View: Crude Oil is approaching the 95.5–95.8 resistance zone. If sellers defend this area and price remains below 96.0, bearish pressure could drive XTI/USD toward the 93.0 support level. 📌 Trade Management: Once price moves in your favor, consider protecting the position and managing risk accordingly. ⚠️ Risk Disclaimer: This is a technical analysis setup, not a guarantee of profit. Always use proper risk management.
XAUUSD (Gold) – 4400 Bearish Pressure Zone 📉 XAUUSD Short Gold vs US Dollar

XAUUSD (Gold) – 4400 Bearish Pressure Zone 📉

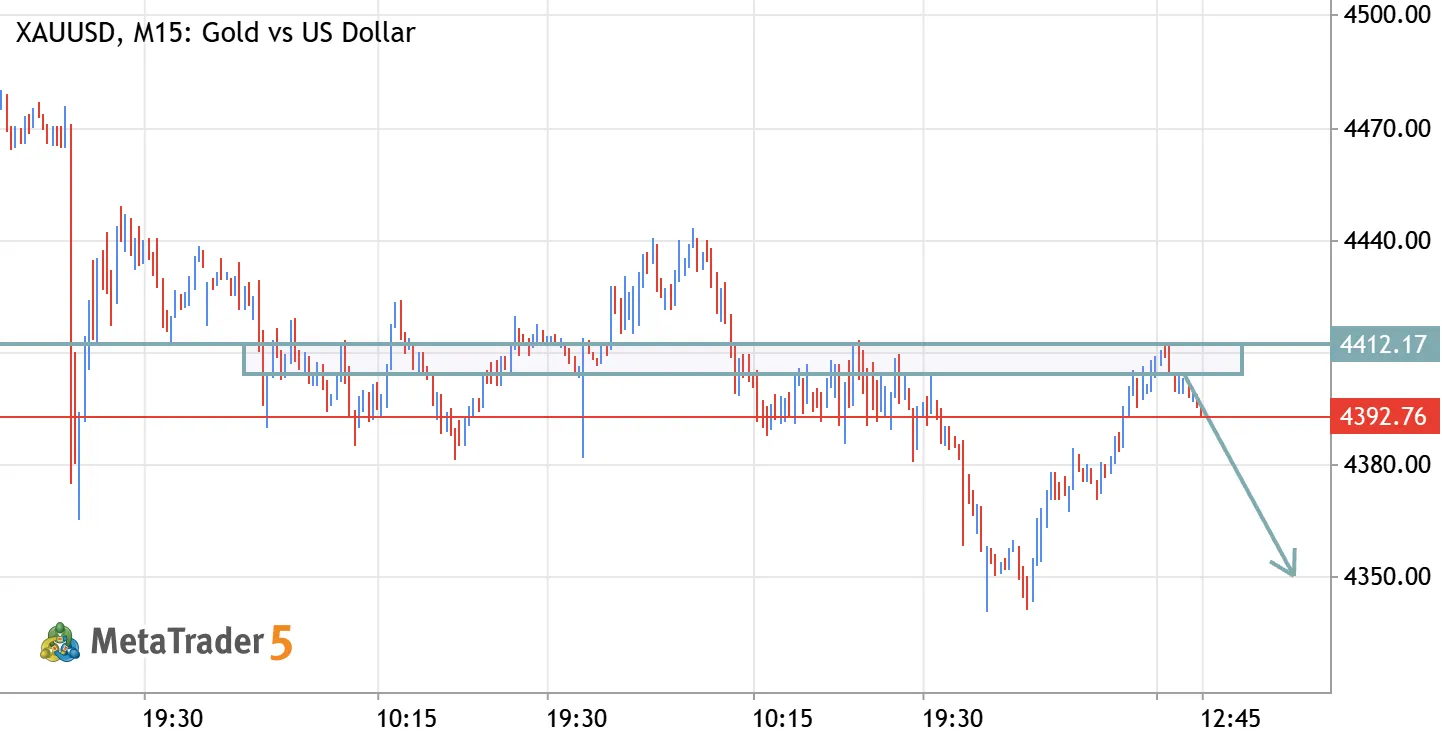
Sell Zone: 4404 – 4414 🛑 Stop Loss: 4425 🎯 Take Profit: • TP1: 4390 • TP2: 4375 • Long TP: 4350 📊 Support & Resistance: • Resistance: 4404 – 4414 • Major Resistance: 4425 • Support 1: 4390 • Support 2: 4375 • Major Support: 4350 Gold is approaching the 4404–4414 resistance zone, where sellers could step in if price fails to break and hold above the area. A bearish move from this zone could target 4390 first, followed by 4375, with an extended move toward 4350. 📌 Trade Management: As price reaches the long TP at 4350, you can book partial profits according to your preference and risk management. Protect profits as the trade moves in your favor. ⚠️ Risk Disclaimer: This is a technical analysis setup, not a guarantee of profit. Always use proper risk management and trade according to
EURUSD H1 Technical Setup: Liquidity Sweep, Fair Value Gap Fill & Supply Zone Rejection Setup EURUSD Short Euro vs US Dollar

EURUSD H1 Technical Setup: Liquidity Sweep, Fair Value Gap Fill & Supply Zone Rejection Setup

EUR/USD on the 1-hour timeframe is currently executing a classic Smart Money Concepts (SMC) expansion pattern. Following a sweep of Buy-Side Liquidity and a trendline liquidity grab, price is turning bullish in the short term toward a higher-timeframe Supply Zone before anticipating a major bearish expansion. Key Technical Elements Buy-Side Liquidity Sweep: Price broke above previous local highs around $1.1625–$1.1635, engineering liquidity before sweeping downward to clear out weak long stop losses. Fair Value Gap (FVG) Mitigation: The pair tapped into a significant 1-hour Fair Value Gap spanning between $1.1620 and $1.1640, using this imbalance zone as temporary support/resistance confluence. Trendline Liquidity Breakout: The descending liquidity trendline has been broken upward
XAUUSD (Gold) M15 Breakdown: Symmetrical Triangle Breakdown & Bearish Retest Setup XAUUSD Short Gold vs US Dollar

XAUUSD (Gold) M15 Breakdown: Symmetrical Triangle Breakdown & Bearish Retest Setup

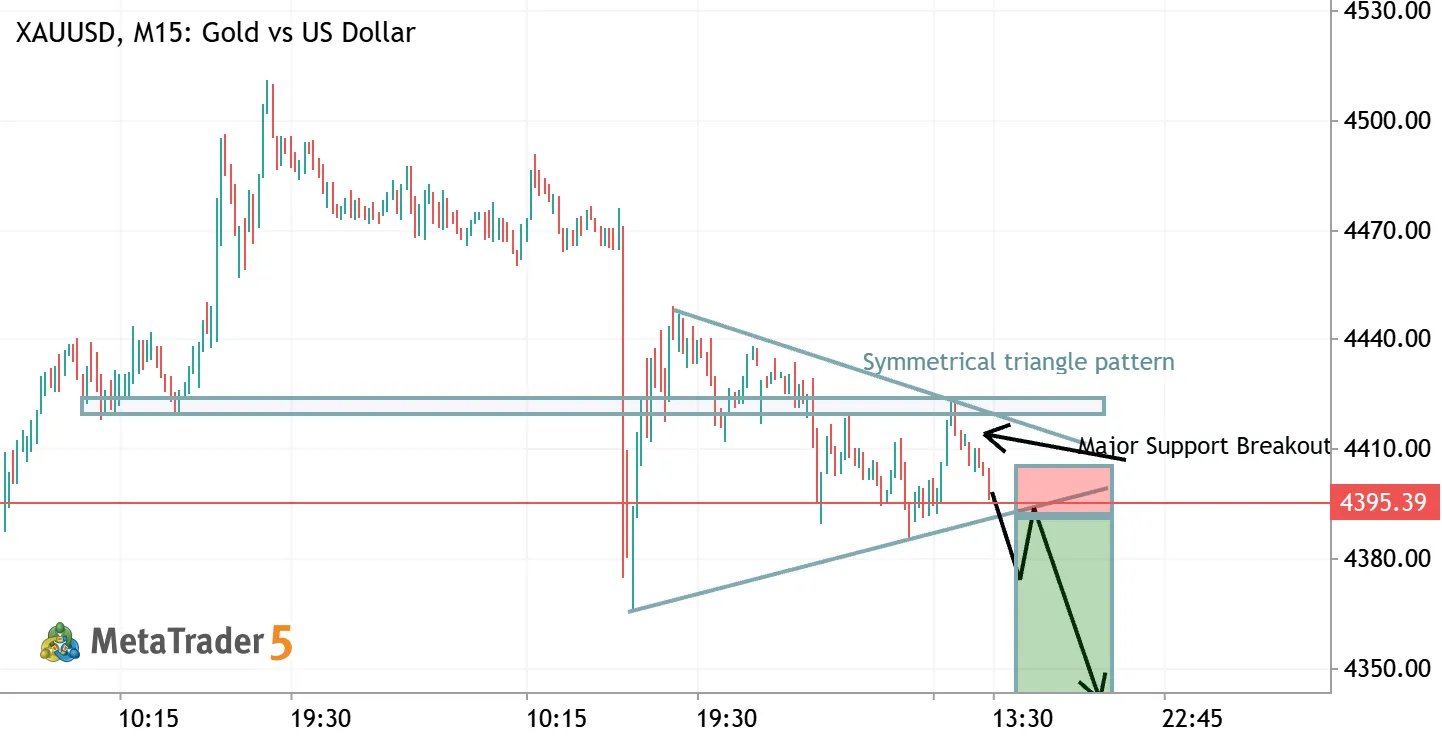
Gold is showing a clean technical continuation pattern on the 15-minute timeframe following a period of consolidation. Below is a breakdown of the structural setup and key levels to monitor: Technical Analysis Pattern Breakout: Price has been coiling inside a Symmetrical Triangle Pattern following a sharp drop. It recently broke through lower support near the $4,395 level. Support Flip: The region between $4,415 – $4,425 previously served as major support. With the recent breakdown below the triangle's rising boundary line, this area now reinforces a strong overhead resistance zone. Price Projection: The projected path indicates a retest of the broken lower trendline/resistance zone near $4,395 before a potential continuation lower toward the $4,350–$4,360 target zone. Potential Short
XAUUSD (Gold) – 4426 - 4436 Bearish Zone XAUUSD Short Gold vs US Dollar

XAUUSD (Gold) – 4426 - 4436 Bearish Zone

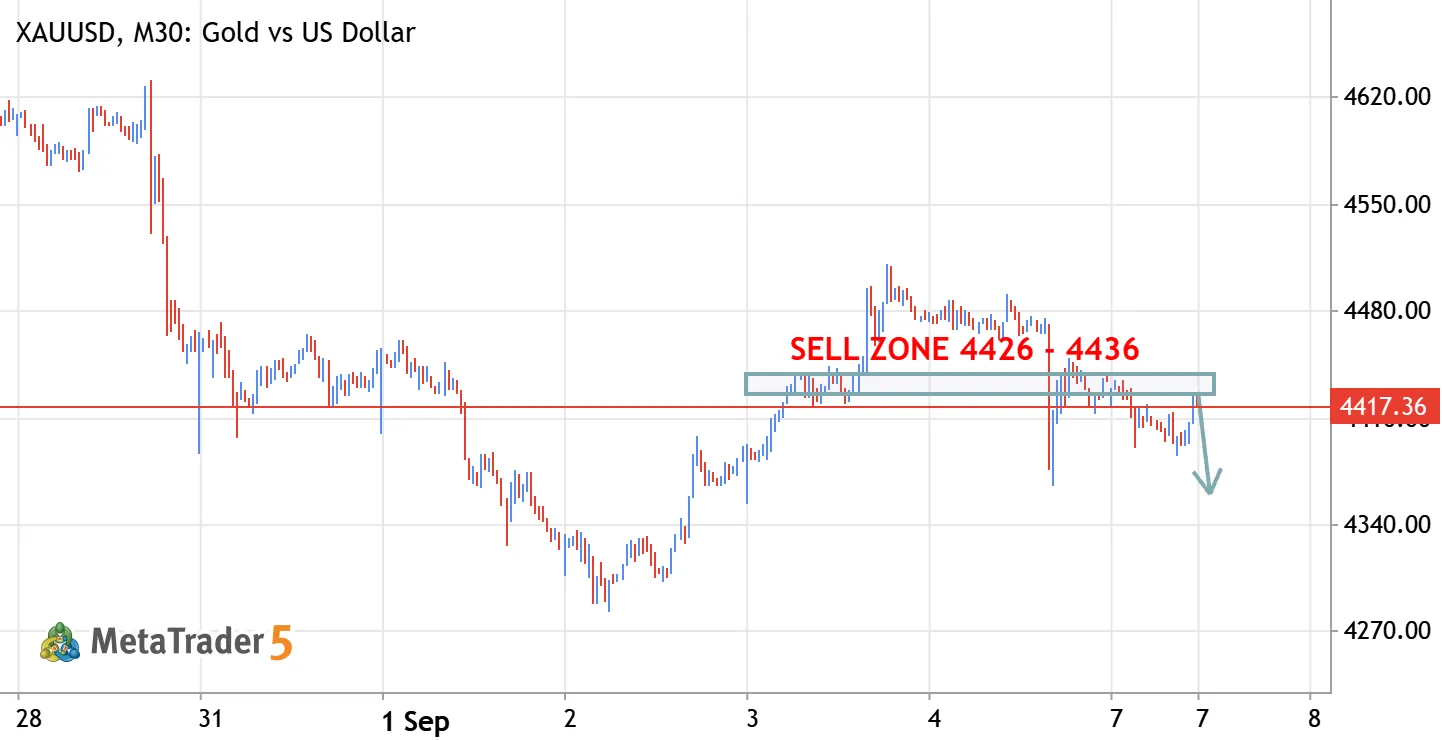
Sell Zone: 4426 – 4436 🛑 Stop Loss: 4450 🎯 Take Profit: • TP1: 4410 • TP2: 4390 • Long TP: 4360 Gold is approaching the 4426–4436 sell zone, where bearish pressure could build if price fails to sustain above this area. The setup targets 4410 first, followed by 4390, with an extended move toward 4360. 📌 Trade Management: At the long TP of 4360, you can book partial profits according to your preference and risk management. Consider protecting profits as price moves in your favor. ⚠️ Risk Disclaimer: This is a technical analysis setup, not a guarantee of profit. Always use proper risk management and trade according to your own strategy.