
BGC
#1298
BGC Group, Inc. - Class A Common Stock
10.9 8 USD
+0.02%
Сектор: Финансы
Базовая: USD
Валюта прибыли: USD
Дневной диапазон
Годовой диапазон
Дневное изменение
+1.86%
Месячное изменение
-7.96%
6-месячное изменение
+23.37%
Годовое изменение
+5.78%
Предыдущее закрытие
10.7 8
Open
10.9 8
Low
10.9 8
High
10.9 8
Volume
291
Financials
Значение 202020212022202320242025 Current
Key stats
Valuation ratios
Profitability ratios
Liquidity ratios
Solvency ratios
Per share metrics
Новости
Акции Virtu Financial достигли исторического максимума $52,21
Bank of America назвал BGC лучшей AI-акцией на рынке капитала
BGC Group: удастся ли сохранить рост прибыли на 37%?
Акции Bgc Group достигли 52-недельного максимума на уровне $11,8
Акции BGC Group достигли 52-недельного максимума в $10,97
Bgc Group: доходы, прибыль побили прогнозы в Q4
BGC Group продает kACE Financial компании smartTrade за $119 млн
BGC Group продаст kACE Financial компании smartTrade за $119 млн
BofA выделяет 16 инвестиционных возможностей вне сферы ИИ
BGC Group: доход вырос на 31% в третьем квартале 2025 года
Bgc Group: доходы, прибыль побили прогнозы в Q3
Графики и идеи
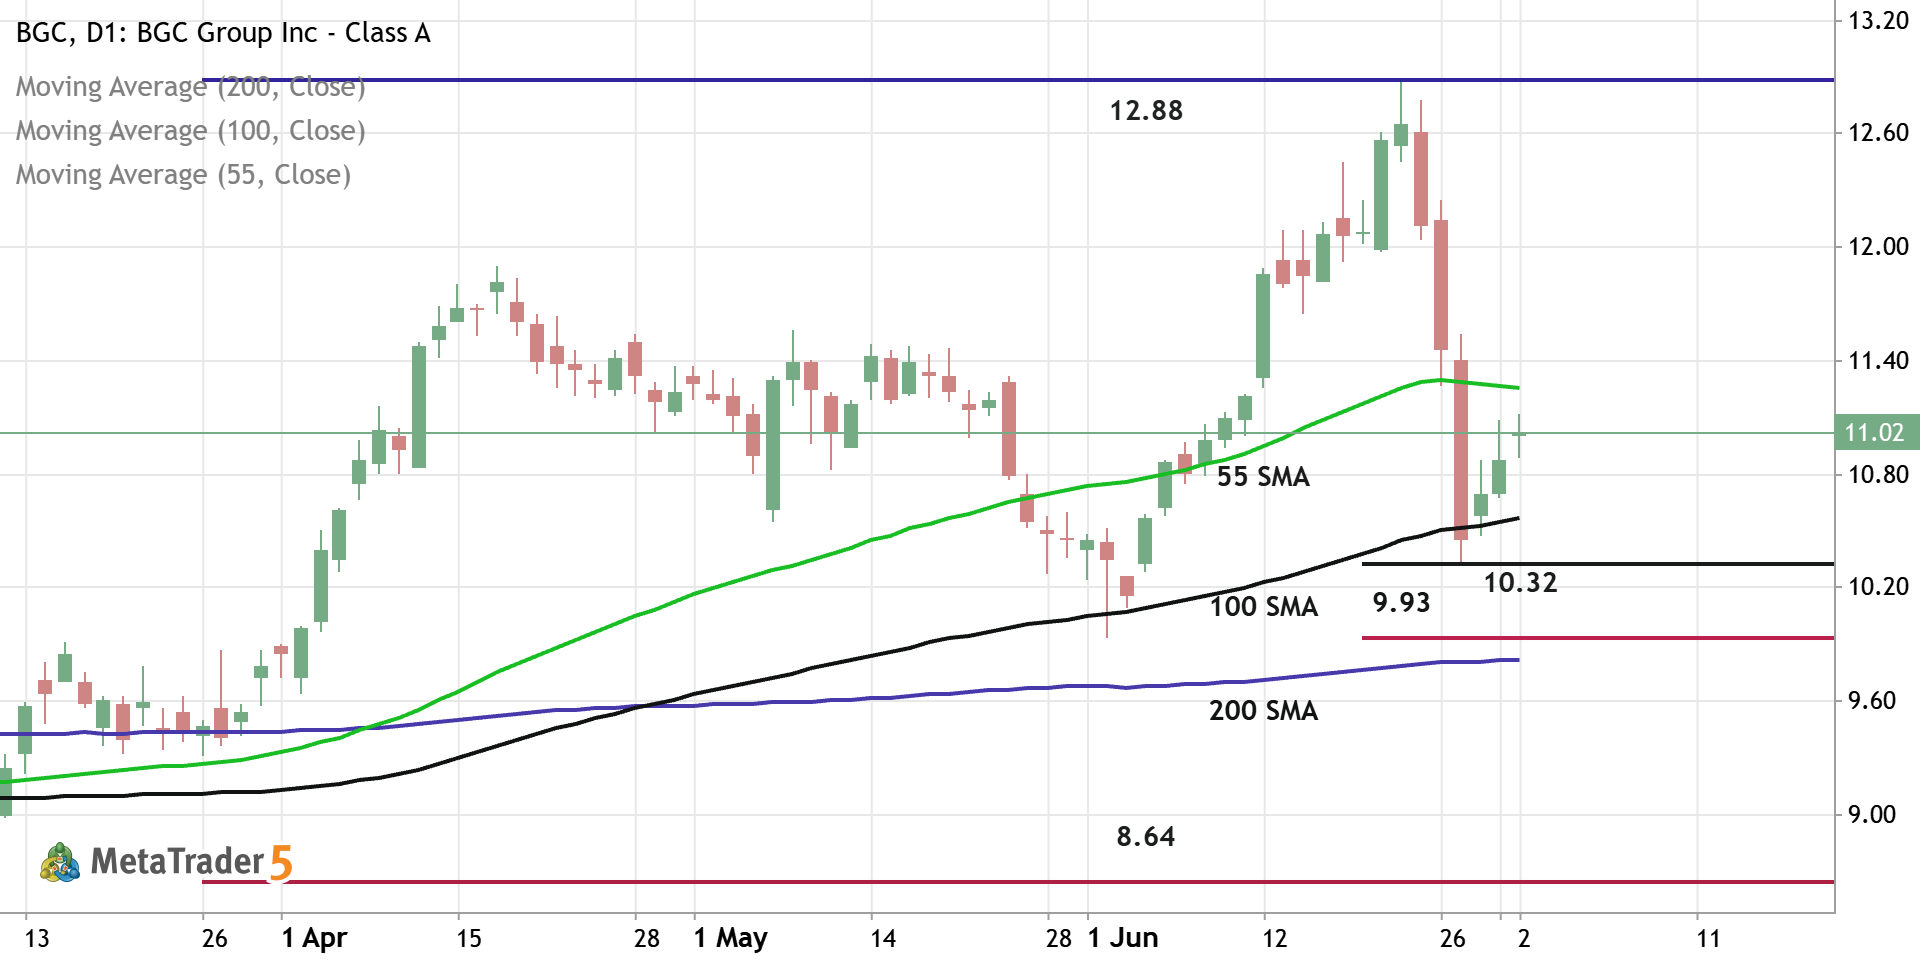
BGC - Daily Trading Forecast
Daily price is located above 200-SMA in the bullish area of the chart. The price was bounced from support level at 10.32 and from 100-SMA to above for the pimary bullish trend to be continuing. If the price breaks 55-SMA to above so the strong bullish trend will be resumed with 12.88 resistance as the global possible target. If the price crosses support level at 9.93 together with 200-SMA to below so the primary bearish reversal will be started with 8.64 support level as the global possible target. Aternatively, the price will be on secondary ranging to be near and above 200 SMA waiting for direction. Trading Summary : waiting for direction
0 

The BGC doesn’t have other trading ideas at this time
Browse ready-made trading ideas or select a symbol and create your own
Go to Charts and Trading Ideas