
BGC
#1298
BGC Group, Inc. - Class A Common Stock
10.9 8 USD
+0.02%
Sector: Finanzas
Básica: USD
Divisa de beneficio: USD
Rango diario
Rango anual
Cambio diario
+1.86%
Variación mensual
-7.96%
Variación en los últimos 6 meses
+23.37%
Cambio anual
+5.78%
Cierres anteriores
10.7 8
Open
10.9 8
Mínimo
10.9 8
High
10.9 8
Volumen
291
Financials
Valor 202020212022202320242025 Current
Key stats
Valuation ratios
Profitability ratios
Liquidity ratios
Solvency ratios
Per share metrics
Noticias
BGC Group lanza una división de mercados de infraestructura informática
Las acciones de BGC Group alcanzan un máximo de 52 semanas en 11,93 dólares
Bank of America señala a BGC como su principal valor de IA en mercados de capitales
BGC Q1 2026: resultados récord impulsados por ECS y Tecnología
¿Puede BGC Group mantener su racha de crecimiento del 37%?
Las acciones de Bgc Group alcanzan un máximo de 52 semanas en 11,8 dólares
Las acciones de BGC Group alcanzan un máximo de 52 semanas en 10,97 dólares
Bgc Group superaron 0.02$ las previsiones de BPA en el cuarto trimestre del año
Bgc Group supera por 0,02$ las previsiones de BPA en el cuarto trimestre del año
BGC reafirma sus perspectivas para el cuarto trimestre de 2025
BGC Group venderá kACE Financial a smartTrade por hasta $119 millones
Gráficos e ideas
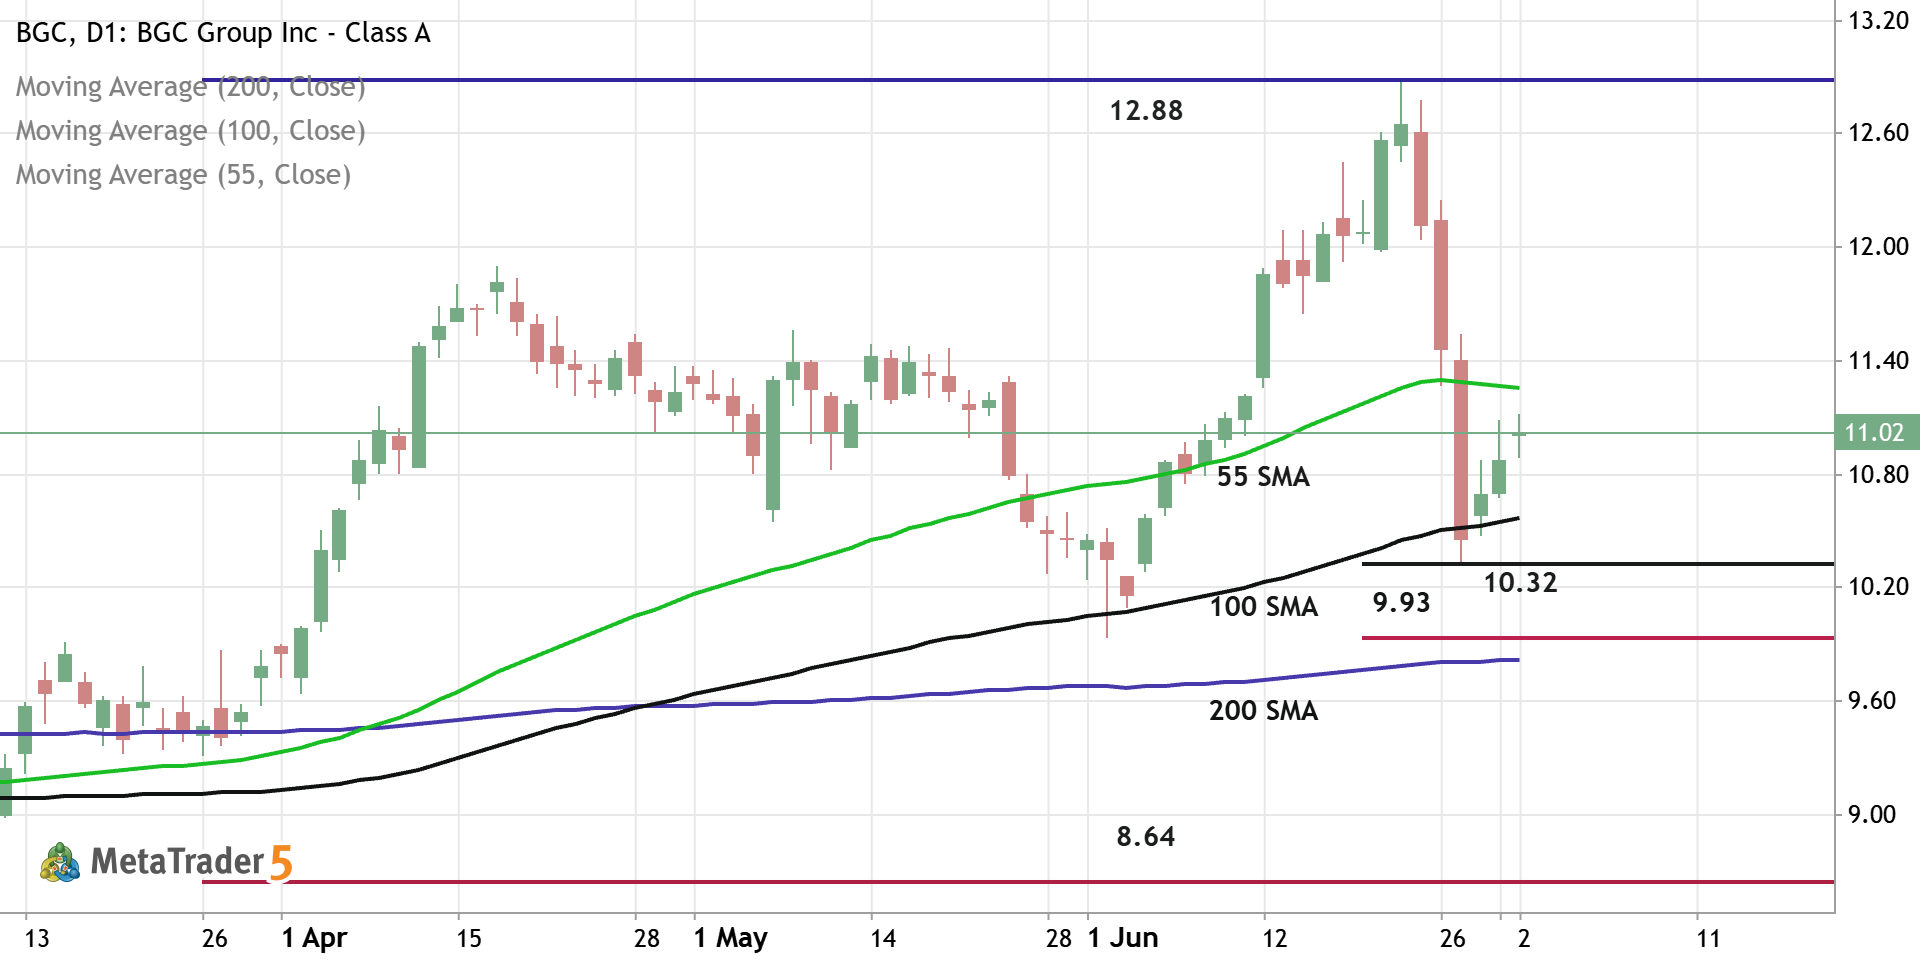
BGC - Daily Trading Forecast
Daily price is located above 200-SMA in the bullish area of the chart. The price was bounced from support level at 10.32 and from 100-SMA to above for the pimary bullish trend to be continuing. If the price breaks 55-SMA to above so the strong bullish trend will be resumed with 12.88 resistance as the global possible target. If the price crosses support level at 9.93 together with 200-SMA to below so the primary bearish reversal will be started with 8.64 support level as the global possible target. Aternatively, the price will be on secondary ranging to be near and above 200 SMA waiting for direction. Trading Summary : waiting for direction
0 

The BGC doesn’t have other trading ideas at this time
Browse ready-made trading ideas or select a symbol and create your own
Go to Charts and Trading Ideas