
BGC
#1310
BGC Group, Inc. - Class A Common Stock
10.9 4 USD
0.00%
Sector: Financial
Base: USD
Profit Currency: USD
Daily Range
Year Range
Daily Change
-0.36%
Monthly Change
-8.30%
6 month change
+22.37%
Year Change
+7.36%
Previous Close
10.9 8
Open
10.9 4
Low
10.9 4
High
10.9 4
Volume
233
Financials
Value 202020212022202320242025 Current
Key stats
Valuation ratios
Profitability ratios
Liquidity ratios
Solvency ratios
Per share metrics
News
BGC Taps AI Boom With Compute Infrastructure Business Launch
BGC Group Stock: How Fenics and FMX Are Shifting the Mix
BGC Stock: Buyback Capacity vs. Expense Pressures in 2026
BGC Global and FMX: A Play on Electronification in U.S. Rates
Is Citigroup (C) Stock Outpacing Its Finance Peers This Year?
Should Value Investors Buy BGC Group, Inc. (BGC) Stock?
BGC vs. MC: Which Stock Is the Better Value Option?
SCHW Ups 2026 Outlook, Targets Mid-Teen EPS Growth Through the Cycle
What Makes BGC Group (BGC) a New Buy Stock
Are Investors Undervaluing BGC Group, Inc. (BGC) Right Now?
BGC Group (BGC) Matches Q1 Earnings Estimates
Charts & Ideas
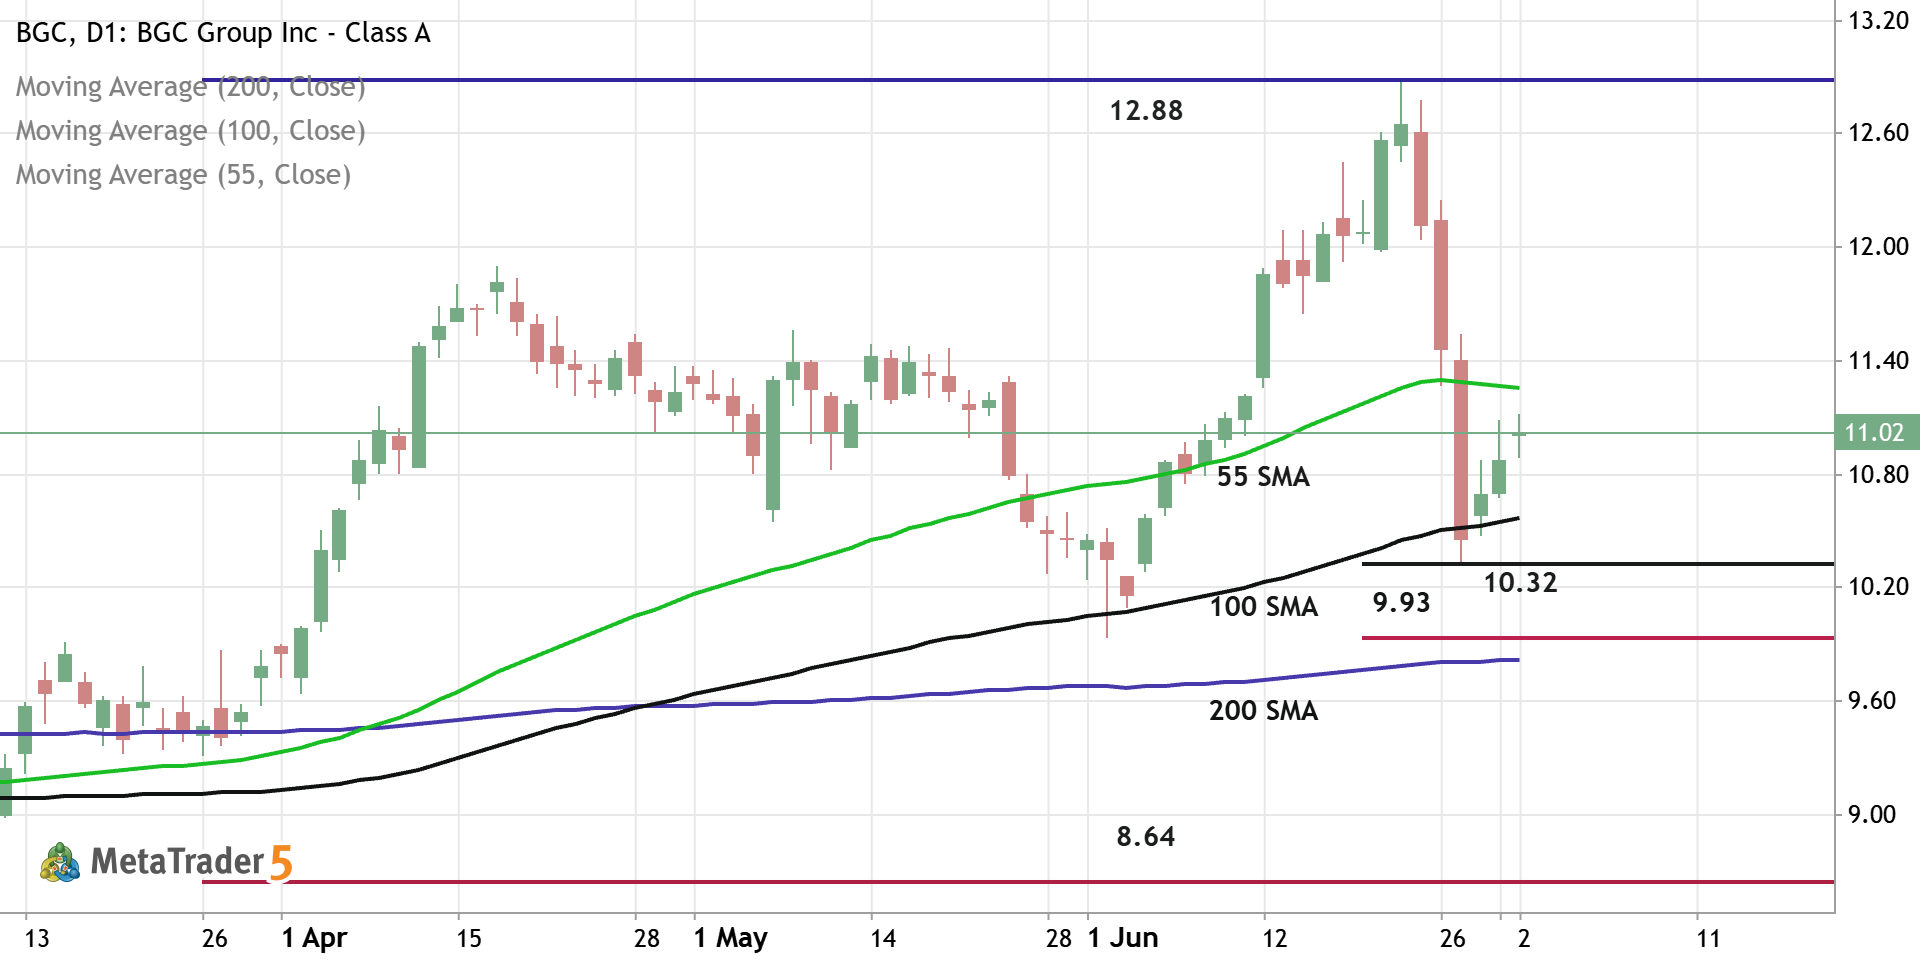
BGC - Daily Trading Forecast
Daily price is located above 200-SMA in the bullish area of the chart. The price was bounced from support level at 10.32 and from 100-SMA to above for the pimary bullish trend to be continuing. If the price breaks 55-SMA to above so the strong bullish trend will be resumed with 12.88 resistance as the global possible target. If the price crosses support level at 9.93 together with 200-SMA to below so the primary bearish reversal will be started with 8.64 support level as the global possible target. Aternatively, the price will be on secondary ranging to be near and above 200 SMA waiting for direction. Trading Summary : waiting for direction
0 

The BGC doesn’t have other trading ideas at this time
Browse ready-made trading ideas or select a symbol and create your own
Go to Charts and Trading Ideas