
BGC
#1310
BGC Group, Inc. - Class A Common Stock
10.9 4 USD
0.00%
Secteur: Financier
Base: USD
Devise de Profit: USD
Range quotidien
Range Annuel
Changement quotidien
-0.36%
Changement Mensuel
-8.30%
Evolution sur 6 mois
+22.37%
Changement Annuel
+7.36%
Clôture Précédente
10.9 8
Open
10.9 4
Low
10.9 4
High
10.9 4
Volume
233
Financials
Valeur 202020212022202320242025 Current
Key stats
Valuation ratios
Profitability ratios
Liquidity ratios
Solvency ratios
Per share metrics
Nouvelles
BGC Group lance une division dédiée aux marchés d’infrastructure de calcul
L’action Virtu Financial atteint un record historique à 52,21 USD
Bank of America désigne BGC comme son premier choix IA sur les marchés de capitaux
BGC T1 2026 : résultats records portés par l’ECS et la technologie
BGC Group : la croissance de 37% peut-elle se poursuivre ?
L’action de Bgc Group atteint un sommet de 52 semaines à 11,8 USD
L’action BGC Group atteint un sommet de 52 semaines à 10,97 USD
Le BPA de Bgc Group a dépassé les attentes de 0,02$, le CA a surpassé les prévisions
BofA liste 16 opportunités d’actions en dehors de l’IA
BGC Group au T3 2025 : Le chiffre d’affaires bondit de 31% grâce aux plateformes électroniques
Le BPA de Bgc Group a dépassé les attentes, le CA a surpassé les prévisions
Graphique & Idées
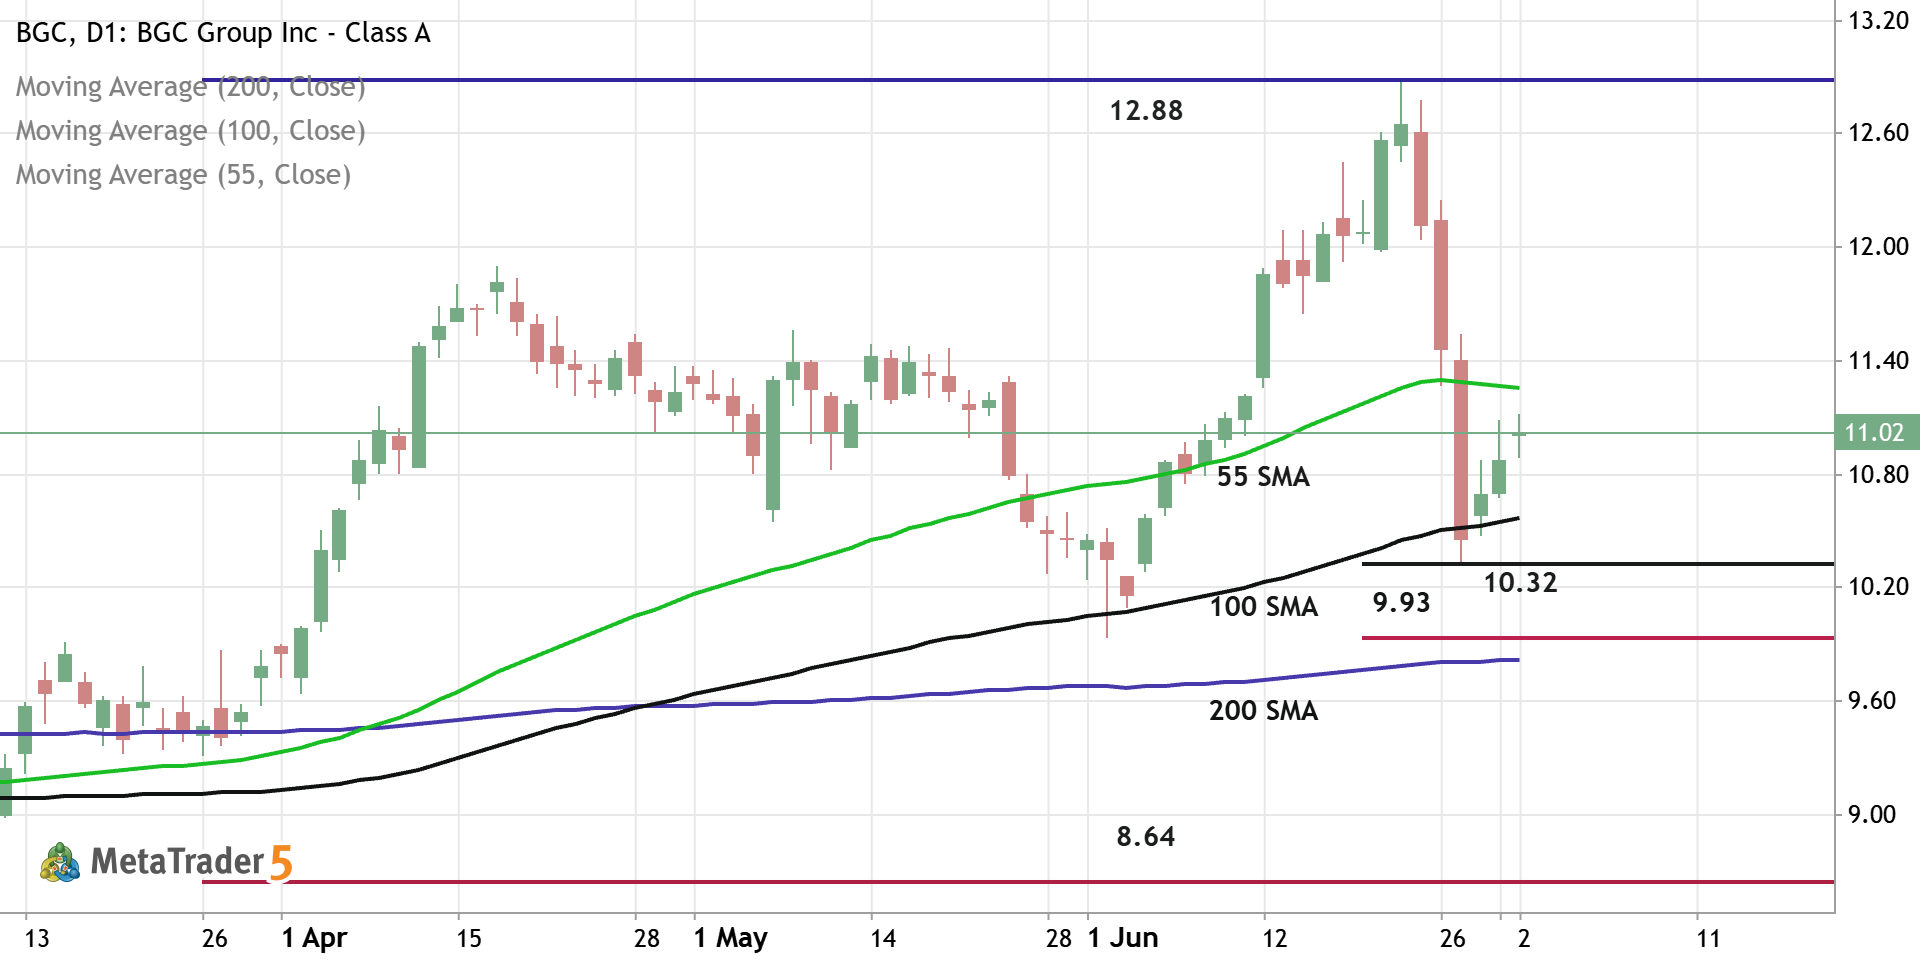
BGC - Daily Trading Forecast
Daily price is located above 200-SMA in the bullish area of the chart. The price was bounced from support level at 10.32 and from 100-SMA to above for the pimary bullish trend to be continuing. If the price breaks 55-SMA to above so the strong bullish trend will be resumed with 12.88 resistance as the global possible target. If the price crosses support level at 9.93 together with 200-SMA to below so the primary bearish reversal will be started with 8.64 support level as the global possible target. Aternatively, the price will be on secondary ranging to be near and above 200 SMA waiting for direction. Trading Summary : waiting for direction
0 

The BGC doesn’t have other trading ideas at this time
Browse ready-made trading ideas or select a symbol and create your own
Go to Charts and Trading Ideas