
BGC
#1307
BGC Group, Inc. - Class A Common Stock
10.9 5 USD
0.00%
Sektör: Finansal
Baz: USD
Kar Para Birimi: USD
Günlük Aralık
Yıllık Aralık
Günlük Değişim
-0.27%
Aylık Değişim
-8.21%
6 Aylık Değişim
+23.03%
Yıllık Değişim
+5.49%
Önceki Kapanış
10.9 8
Open
10.9 1
Düşük
10.8 9
High
10.9 6
Hacim
234
Financials
Değer 202020212022202320242025 Current
Key stats
Valuation ratios
Profitability ratios
Liquidity ratios
Solvency ratios
Per share metrics
Haberler
BGC Group hesaplama altyapısı piyasaları bölümünü başlattı
Virtu Financial hissesi 52,21 dolarla rekor kırdı
BofA, sermaye piyasalarında BGC’yi en iyi yapay zeka hissesi olarak işaretledi
BGC’nin 2026 1Ç sunumu: ECS artışı rekor kazanç getirdi
BGC Group kazançları açıklanıyor: %37’lik büyüme devam eder mi?
Bgc Group hissesi 11,8 dolarda 52 haftalık zirveye ulaştı
BGC Group hissesi 10,97 dolarda 52 haftanın zirvesine ulaştı
Piper Sandler, güçlü rehberlik sonrası BGC Group hisse senedi derecelendirmesini yineledi
Bgc Group kazancı $0,02 ile beklentilere göre daha iyi, kâr ise beklentilere göre yüksek
BGC Group, kACE Financial’ı smartTrade’e 119 milyon dolara kadar sattı
BGC Group, kACE Financial’ı smartTrade’e 119 milyon dolara kadar satacak
Grafikler ve Fikirler
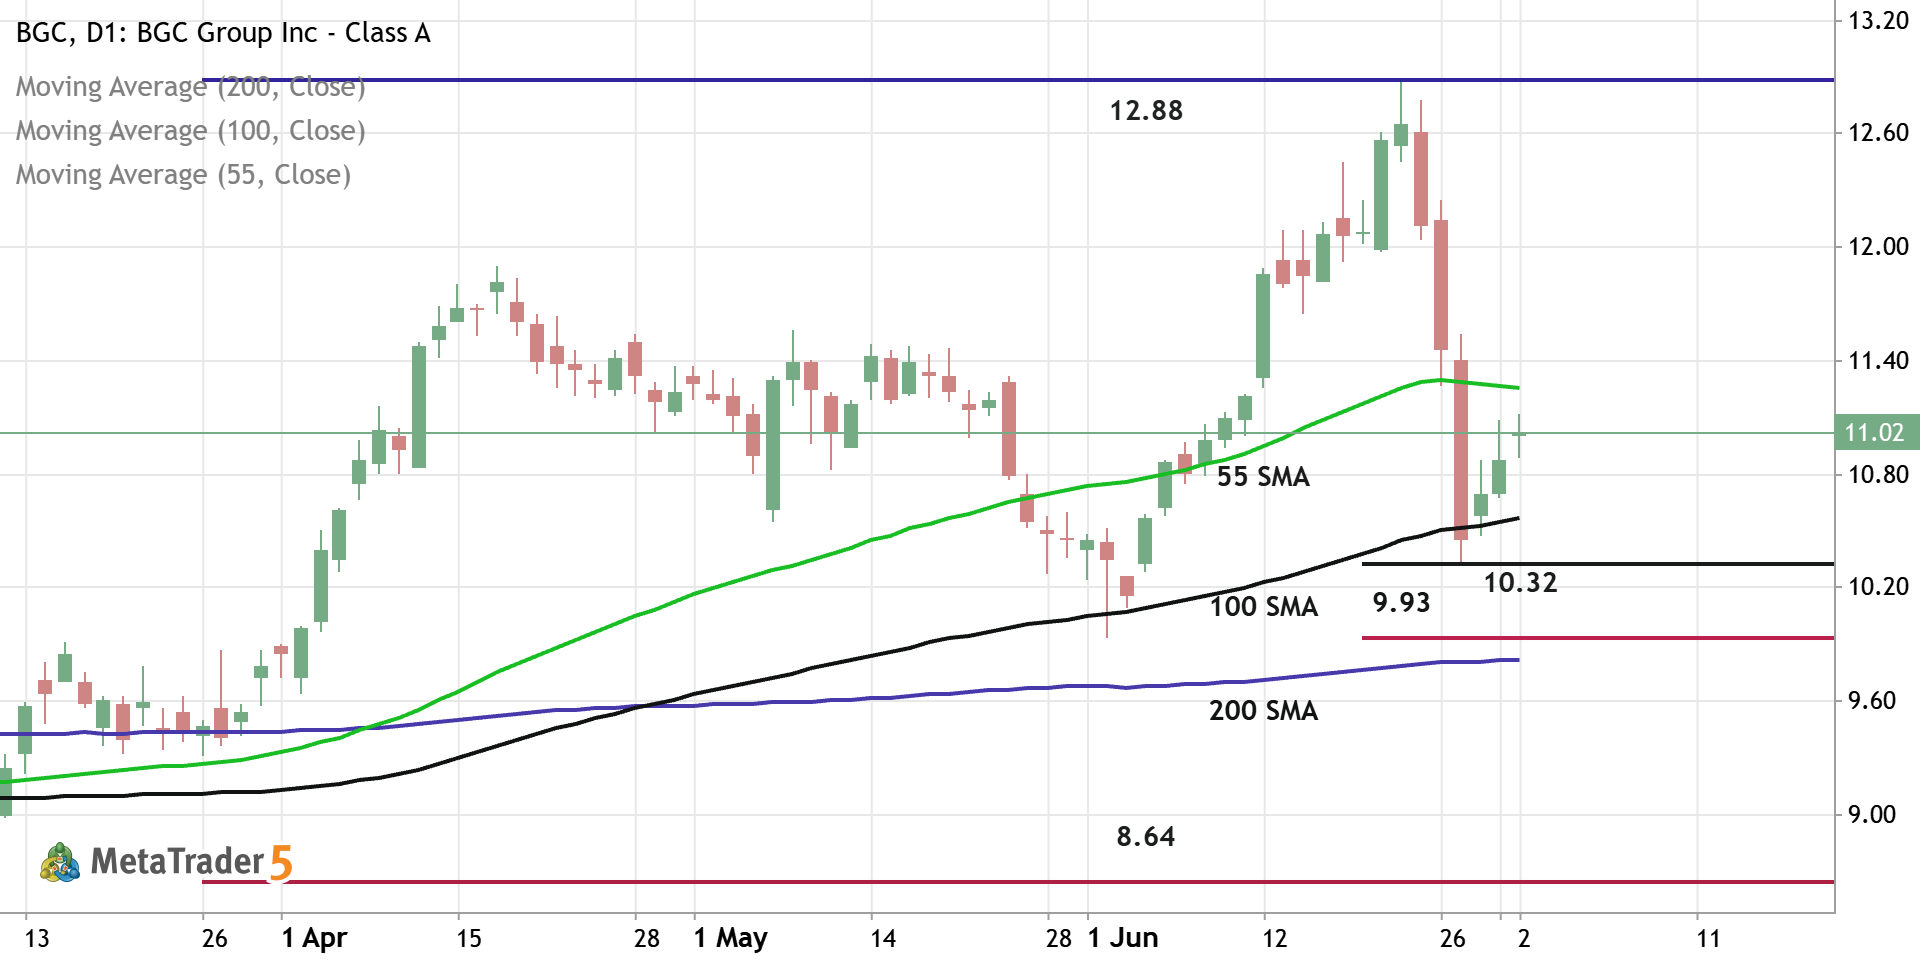
BGC - Daily Trading Forecast
Daily price is located above 200-SMA in the bullish area of the chart. The price was bounced from support level at 10.32 and from 100-SMA to above for the pimary bullish trend to be continuing. If the price breaks 55-SMA to above so the strong bullish trend will be resumed with 12.88 resistance as the global possible target. If the price crosses support level at 9.93 together with 200-SMA to below so the primary bearish reversal will be started with 8.64 support level as the global possible target. Aternatively, the price will be on secondary ranging to be near and above 200 SMA waiting for direction. Trading Summary : waiting for direction
0 

The BGC doesn’t have other trading ideas at this time
Browse ready-made trading ideas or select a symbol and create your own
Go to Charts and Trading Ideas