
BGC
#1307
BGC Group, Inc. - Class A Common Stock
10.9 5 USD
0.00%
부문: 금융
베이스: USD
수익 통화: USD
일일 변동 비율
년간 변동
일일 변동
-0.27%
월간 변동
-8.21%
6달 변화
+23.03%
년간 변동율
+5.49%
이전 종가
10.9 8
Open
10.9 1
저가
10.8 9
High
10.9 6
양
234
Financials
값 202020212022202320242025 Current
Key stats
Valuation ratios
Profitability ratios
Liquidity ratios
Solvency ratios
Per share metrics
뉴스
Bgc Group Q4 실적, 수익 예상치를 넘어
뱅크오브아메리카, AI 외 16개 주식 투자 기회 제시
BGC 그룹 2025년 3분기 실적 발표: 전자 플랫폼 시장 점유율 확대에 힘입어 매출 31% 급증
Bgc Group Q3 실적, 수익 예상치를 넘어
BGC 그룹, 전자 거래 호조에 2분기 매출 42% 급증
BGC 그룹(BGC), 하워드 러트닉 주식 8260만 달러에 매각
Cantor Fitzgerald, BGC 그룹 주식 8260만 달러 상당 매입
BGC 그룹, 하워드 러트닉 지분 매각 완료…브랜든 러트닉 지배력 확보
BGC 그룹, 7억 달러 규모 선순위 채권 교환 만기 연장
차트 & 아이디어
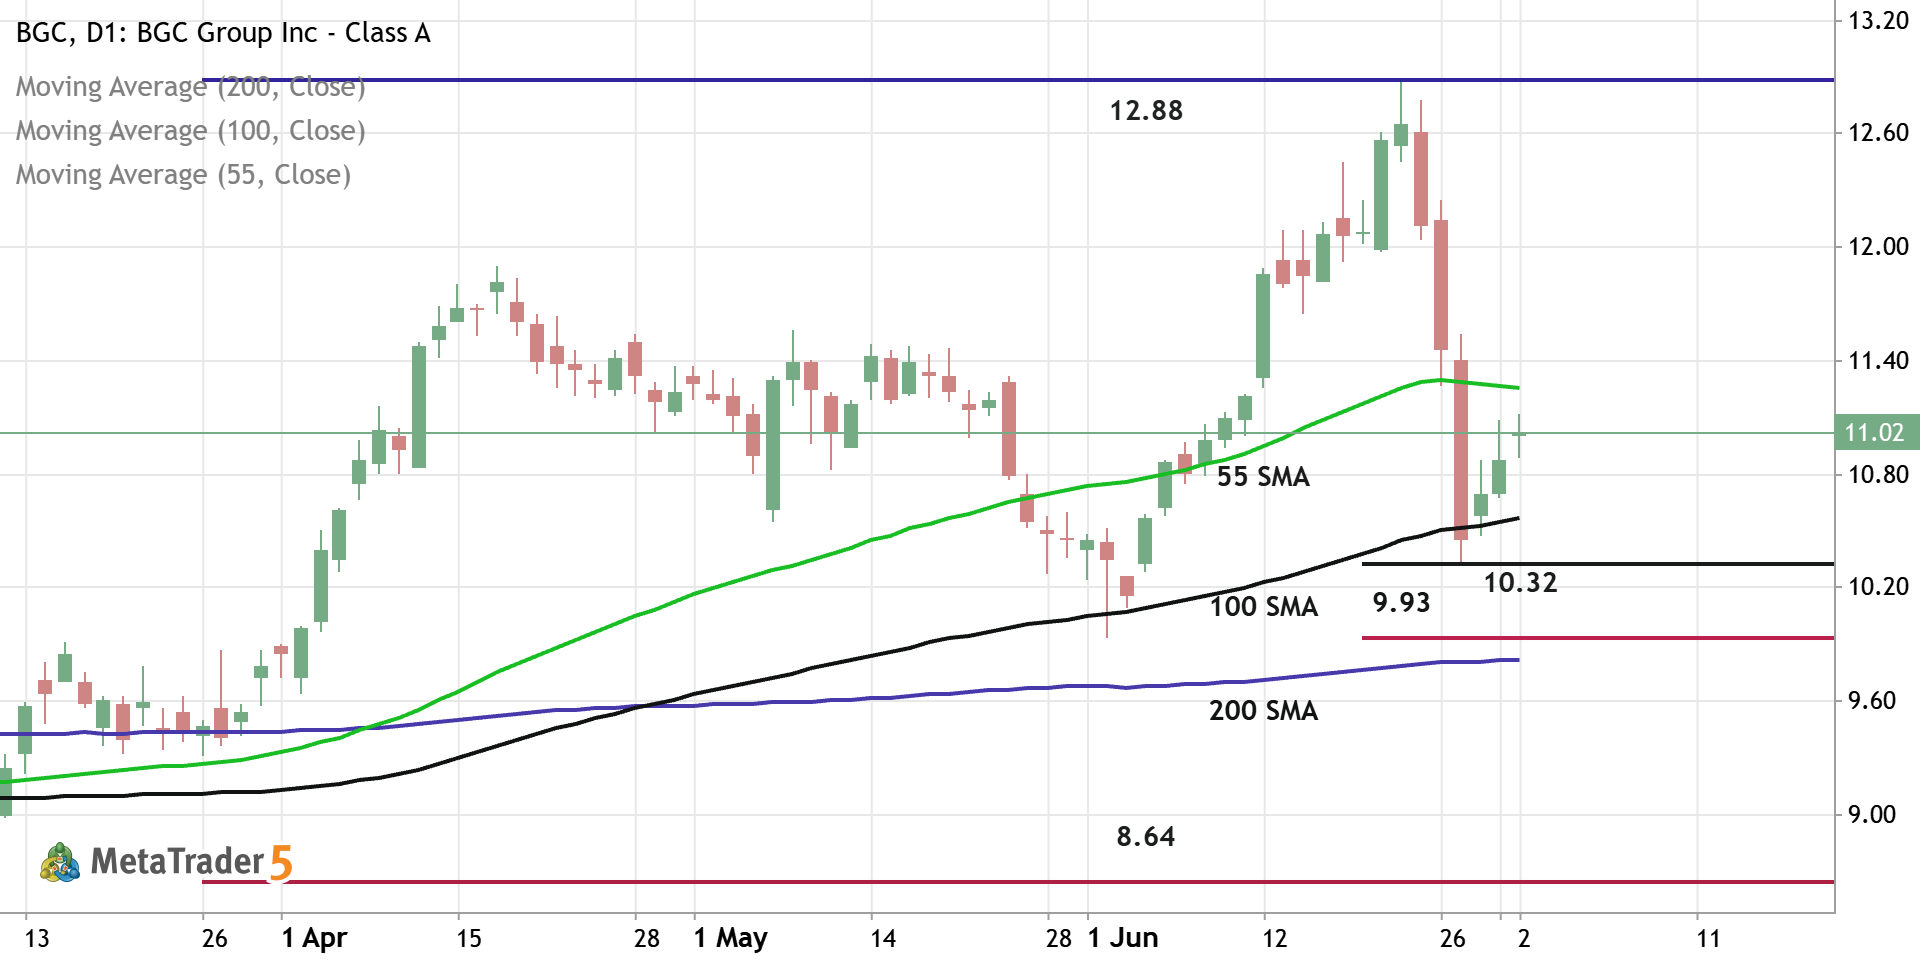
BGC - Daily Trading Forecast
Daily price is located above 200-SMA in the bullish area of the chart. The price was bounced from support level at 10.32 and from 100-SMA to above for the pimary bullish trend to be continuing. If the price breaks 55-SMA to above so the strong bullish trend will be resumed with 12.88 resistance as the global possible target. If the price crosses support level at 9.93 together with 200-SMA to below so the primary bearish reversal will be started with 8.64 support level as the global possible target. Aternatively, the price will be on secondary ranging to be near and above 200 SMA waiting for direction. Trading Summary : waiting for direction
0 

The BGC doesn’t have other trading ideas at this time
Browse ready-made trading ideas or select a symbol and create your own
Go to Charts and Trading Ideas