
BGC
#1298
BGC Group, Inc. - Class A Common Stock
10.9 8 USD
+0.02%
Setor: Finanças
Base: USD
Moeda do lucro: USD
Faixa diária
Faixa anual
Mudança diária
+1.86%
Mudança mensal
-7.96%
Mudança em 6 meses
+23.37%
Mudança anual
+5.78%
Fechamento anterior
10.7 8
Open
10.9 8
Mínimo
10.9 8
High
10.9 8
Volume
291
Financials
Valor 202020212022202320242025 Current
Key stats
Valuation ratios
Profitability ratios
Liquidity ratios
Solvency ratios
Per share metrics
Notícias
BGC Group lança divisão de mercados de infraestrutura computacional
Ação da Virtu Financial atinge máxima histórica de US$ 52,21
Bank of America aponta BGC como principal ação de IA nos mercados de capitais
Slides do 1º tri 2026 da BGC: lucros recordes impulsionados pelo avanço do ECS e ganhos em Tecnologia
BGC Group divulga resultados: crescimento de 37% vai continuar?
Ações da Bgc Group atingem máxima de 52 semanas a US$ 11,80
Ações da BGC Group atingem máxima de 52 semanas a US$ 10,97
Lucro da Bgc Group superou projeções por $0,02; receita supera estimativas
BofA lista 16 oportunidades de ações fora da inteligência artificial
BGC Group no 3º tri 2025: Receita dispara 31% com plataformas eletrônicas ganhando mercado
Lucro da Bgc Group superou projeções; receita supera estimativas
Gráficos e ideias
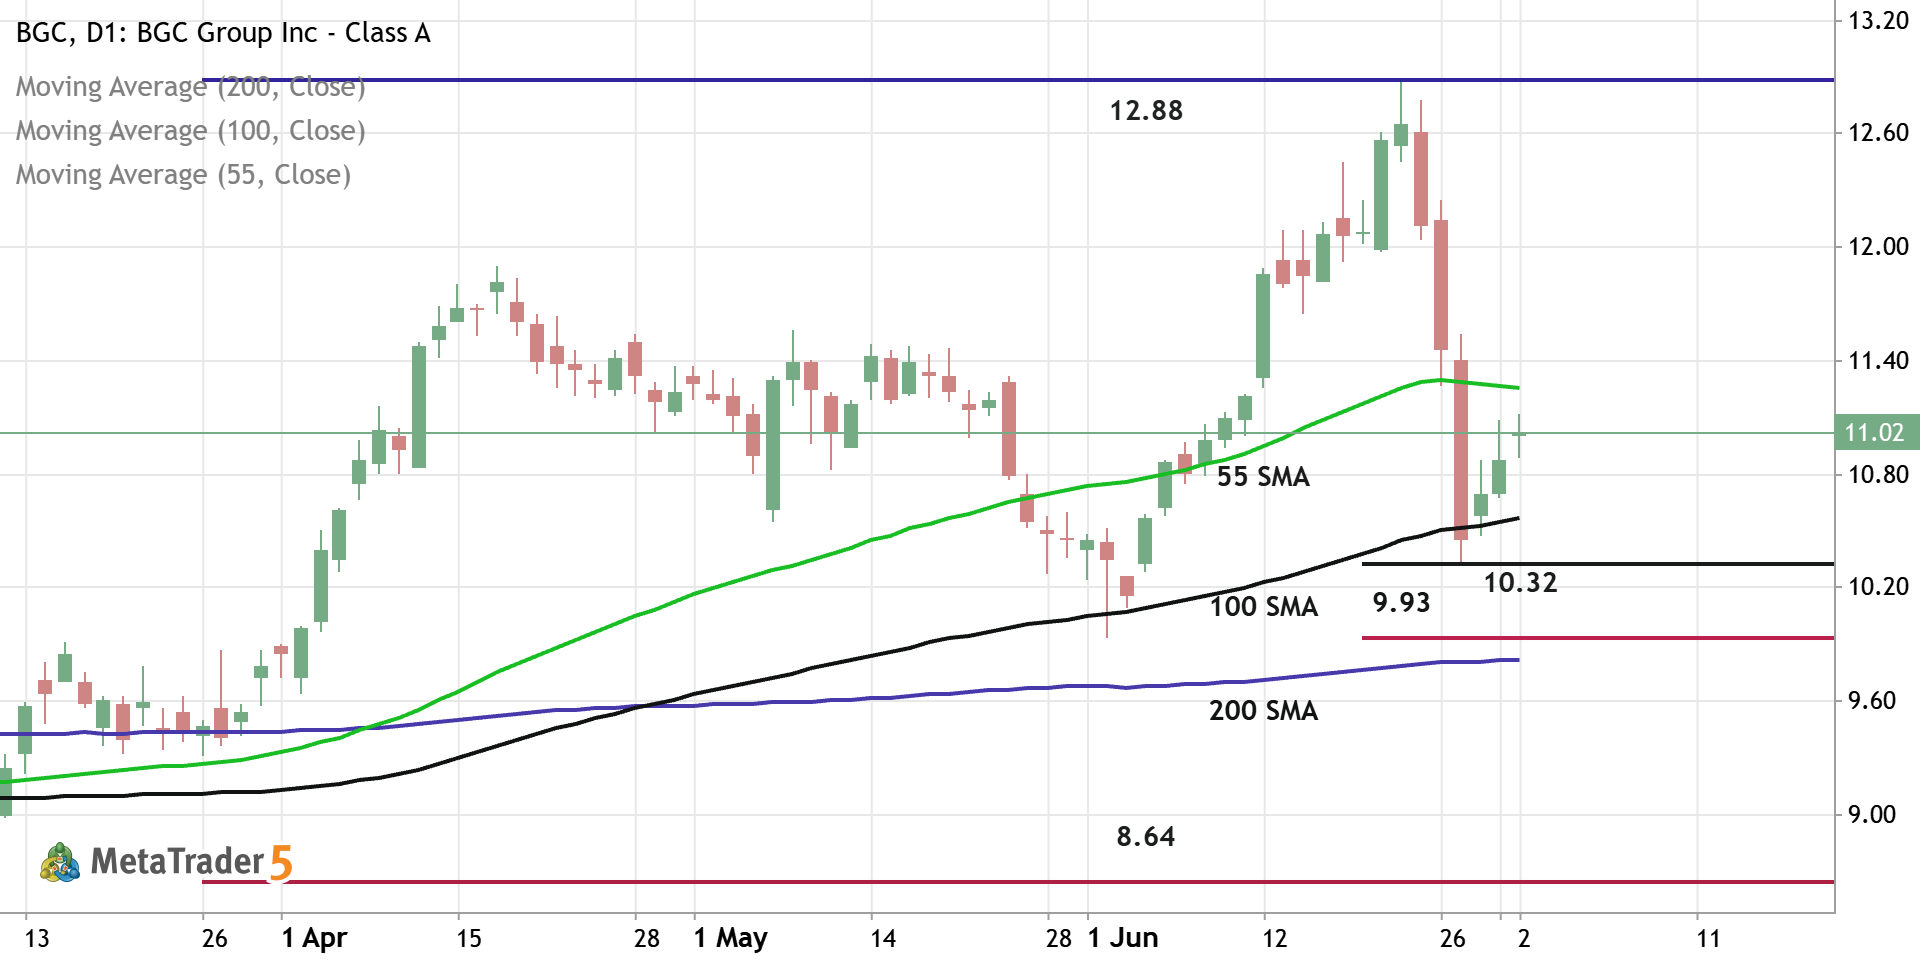
BGC - Daily Trading Forecast
Daily price is located above 200-SMA in the bullish area of the chart. The price was bounced from support level at 10.32 and from 100-SMA to above for the pimary bullish trend to be continuing. If the price breaks 55-SMA to above so the strong bullish trend will be resumed with 12.88 resistance as the global possible target. If the price crosses support level at 9.93 together with 200-SMA to below so the primary bearish reversal will be started with 8.64 support level as the global possible target. Aternatively, the price will be on secondary ranging to be near and above 200 SMA waiting for direction. Trading Summary : waiting for direction
0 

The BGC doesn’t have other trading ideas at this time
Browse ready-made trading ideas or select a symbol and create your own
Go to Charts and Trading Ideas