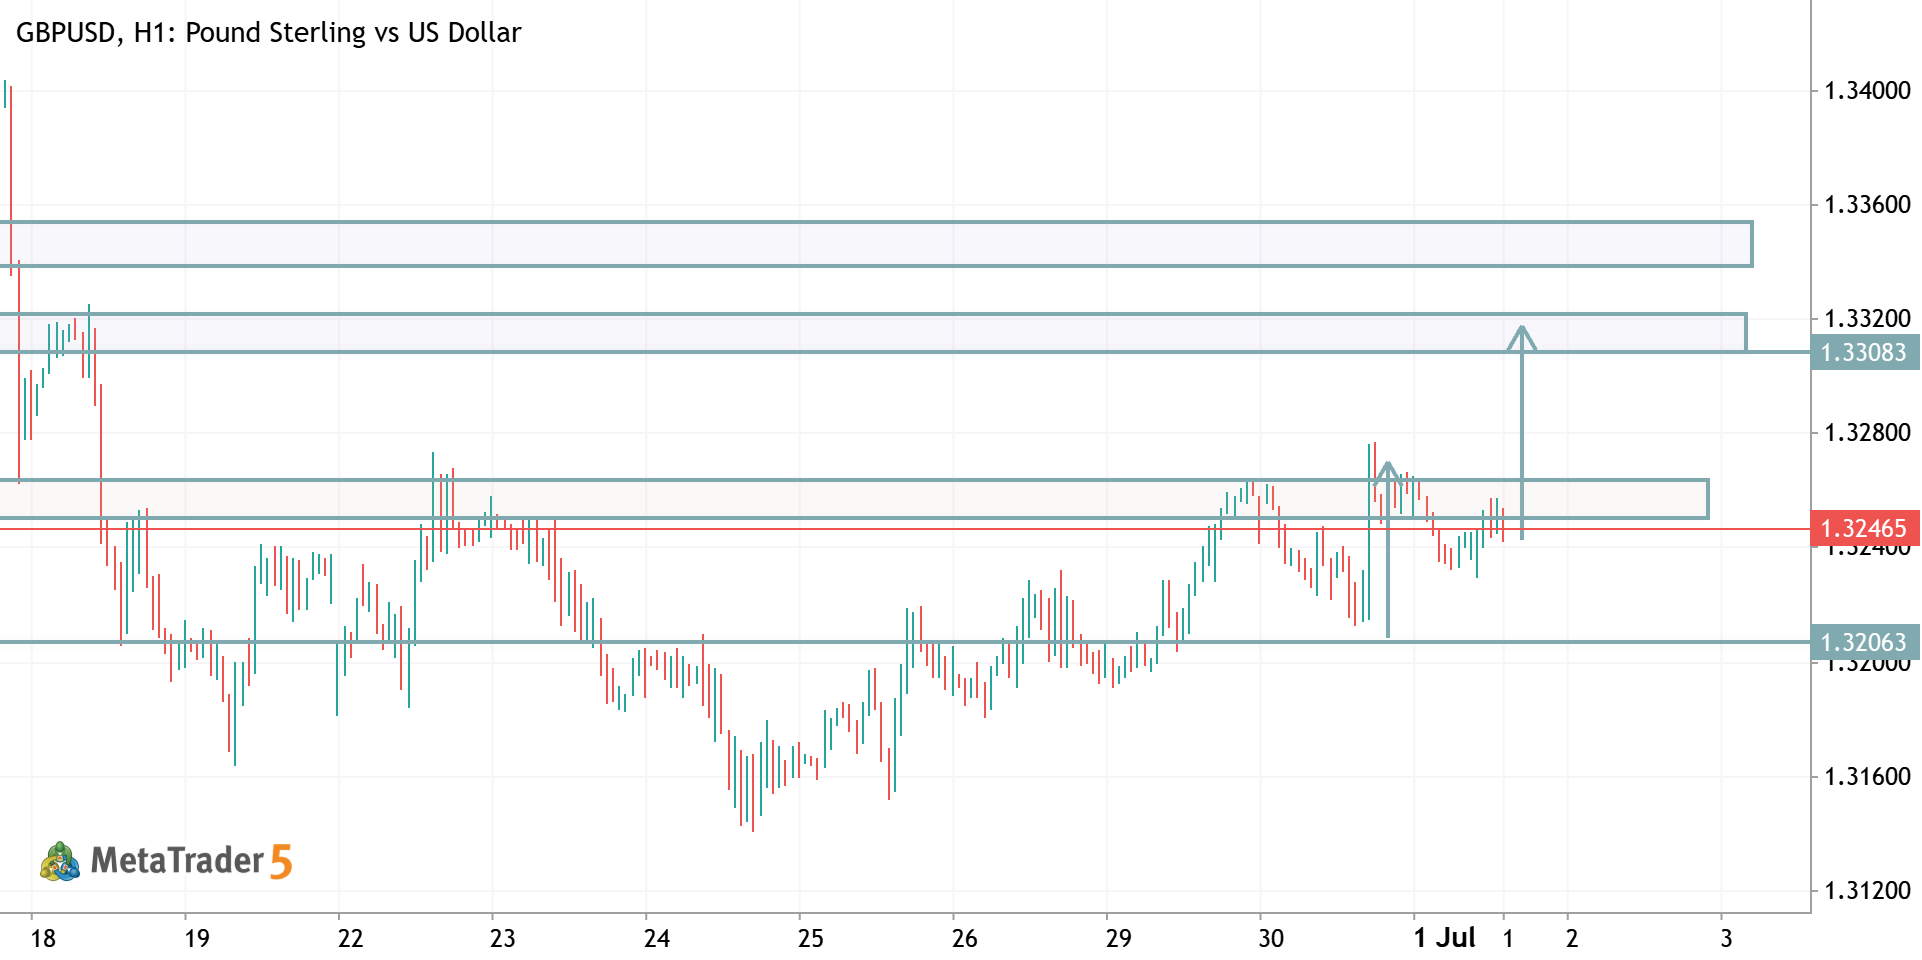
GBPUSD TRADE IDEA
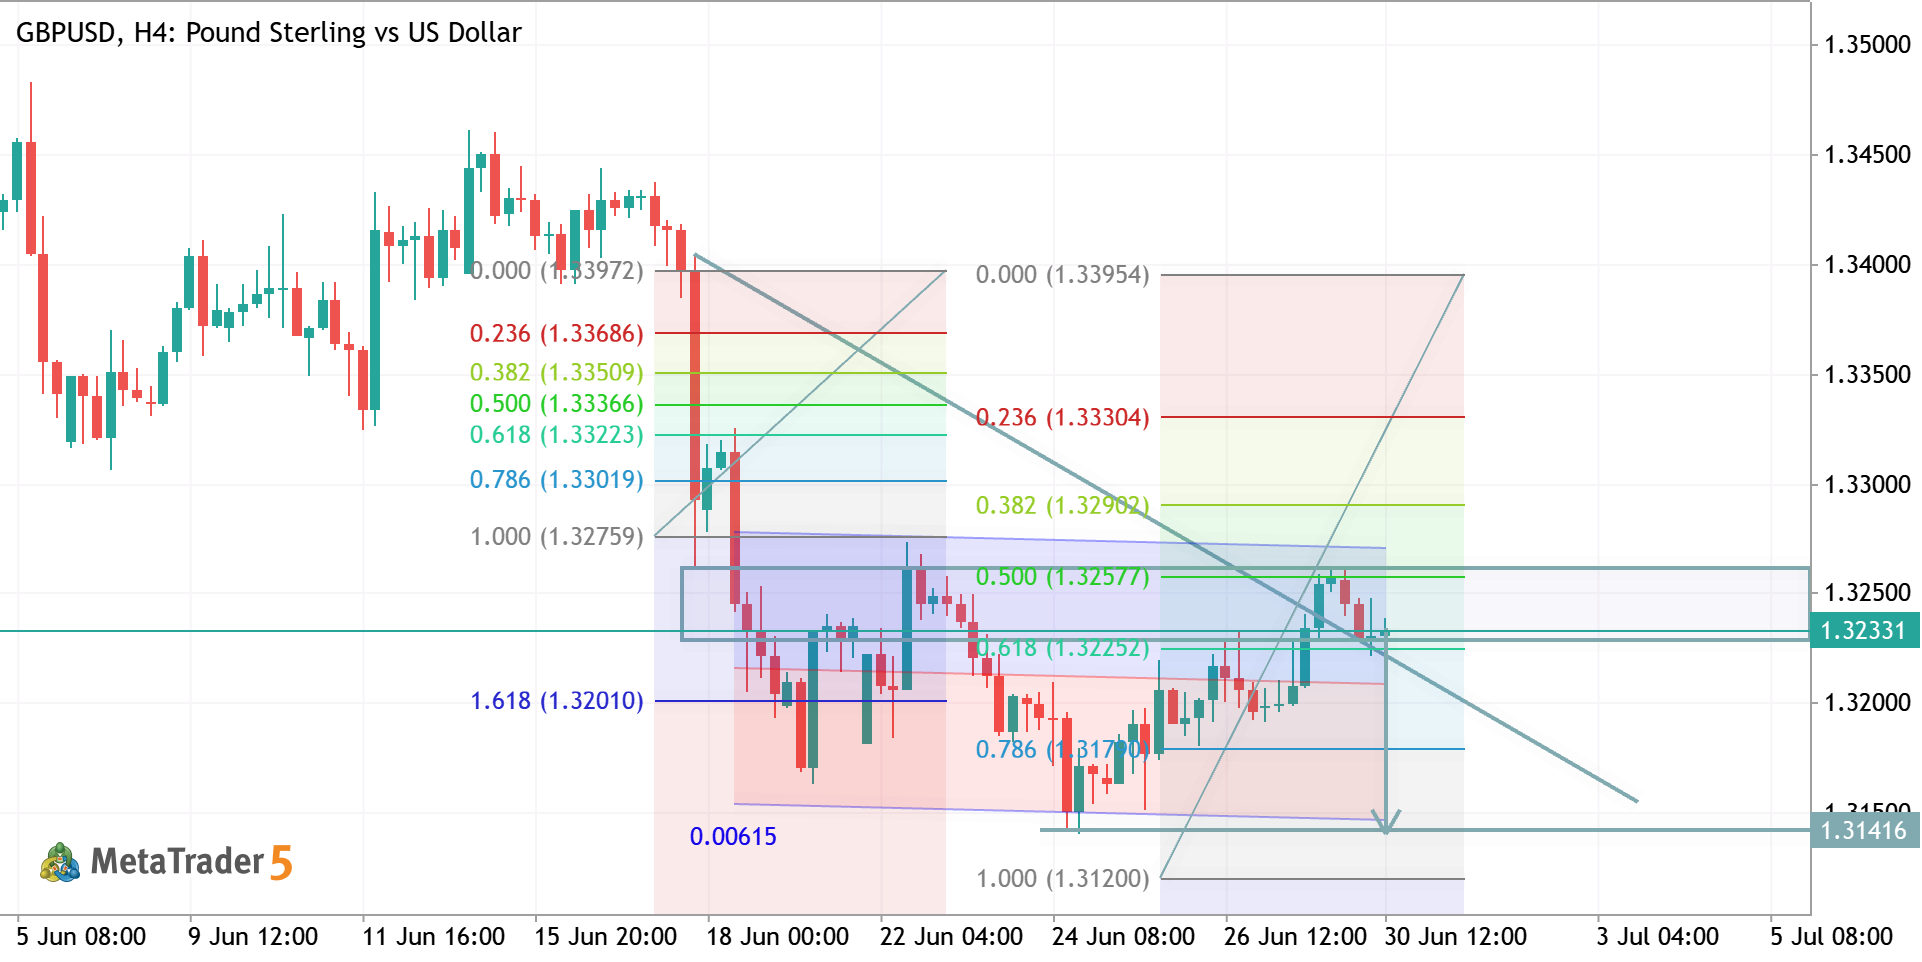
GBPUSD (H1) – Short Trade Setup Based on your chart, a short is reasonable if price rejects the resistance zone around 1.3250–1.3268 . Entry: Sell: 1.3250–1.3265 (after bearish confirmation) Stop Loss: 1.3275–1.3280 (above the recent swing high) Take Profit: TP1: 1.3206 TP2: 1.3160 TP3: 1.3135 (if bearish momentum accelerates) Trade Reason Price is testing a key resistance/supply zone . The overall trend remains bearish despite the recent recovery. A rejection from resistance offers a favorable risk-to-reward setup. Bias: Bearish (Short) , but wait for a bearish rejection candle or a break below the most recent H1 higher low before entering.
1