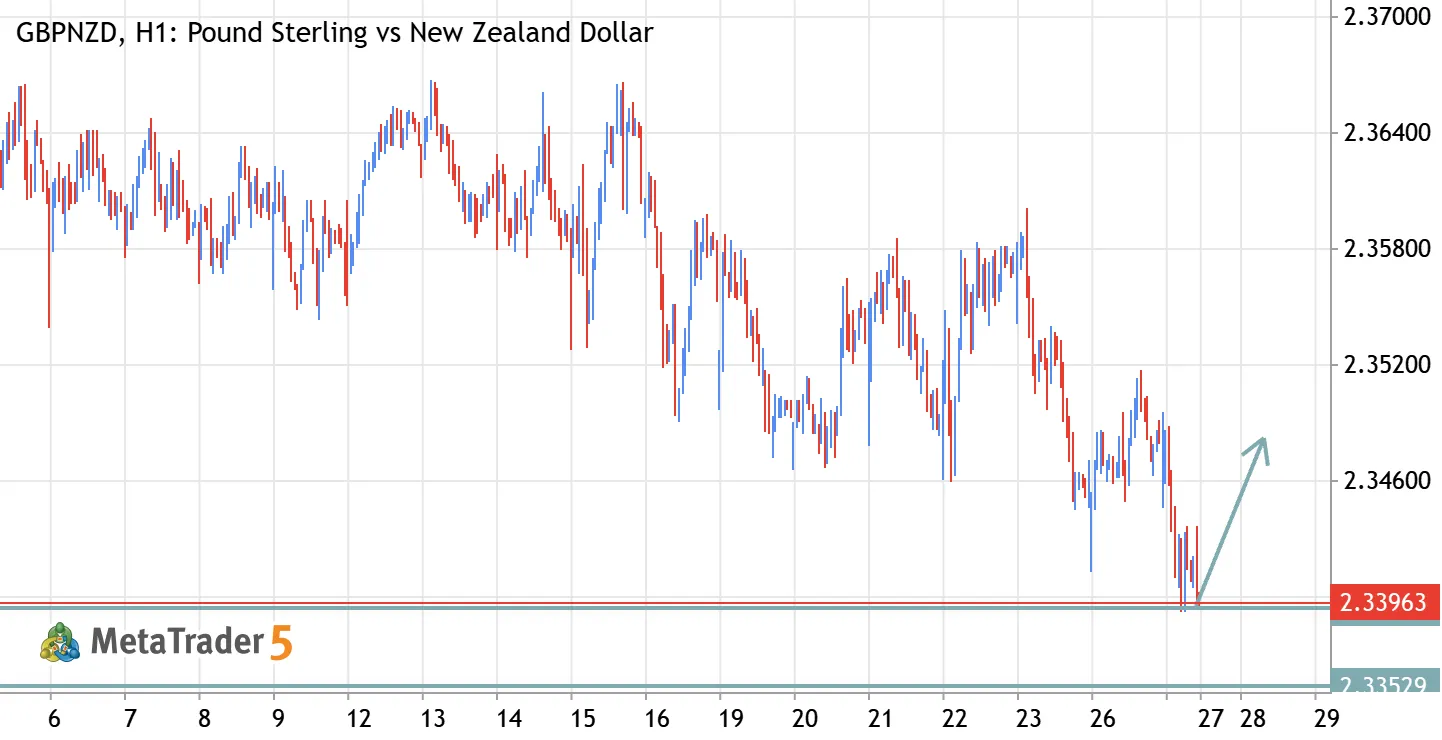
GBPAUD – Bullish Momentum Setup GBPNZD Long Pound Sterling vs New Zealand Dollar

GBPAUD – Bullish Momentum Setup

GBP/AUD Buy Signal Buy Zone: 2.33943 – 2.33812 Stop Loss: 2.33697 Take Profit 1: 2.34328 Take Profit 2: 2.34820 📚 Educational Market Idea: GBP/AUD is approaching the 2.33943–2.33812 buy zone, where buyers may step in and attempt to push price higher. If the zone holds and bullish price action confirms buying pressure, the pair could move toward 2.34328, followed by 2.34820. Watch for bullish confirmation, such as a strong bullish candle, a bullish engulfing pattern, or a recovery above nearby resistance before entering. 📌 Trade Management: Consider securing partial profits at TP1 and allowing the remaining position to target TP2 if bullish momentum continues. Follow your predefined risk-management plan and reassess the setup if price breaks below the buy zone. ⚠️ Risk Disclaimer: Forex

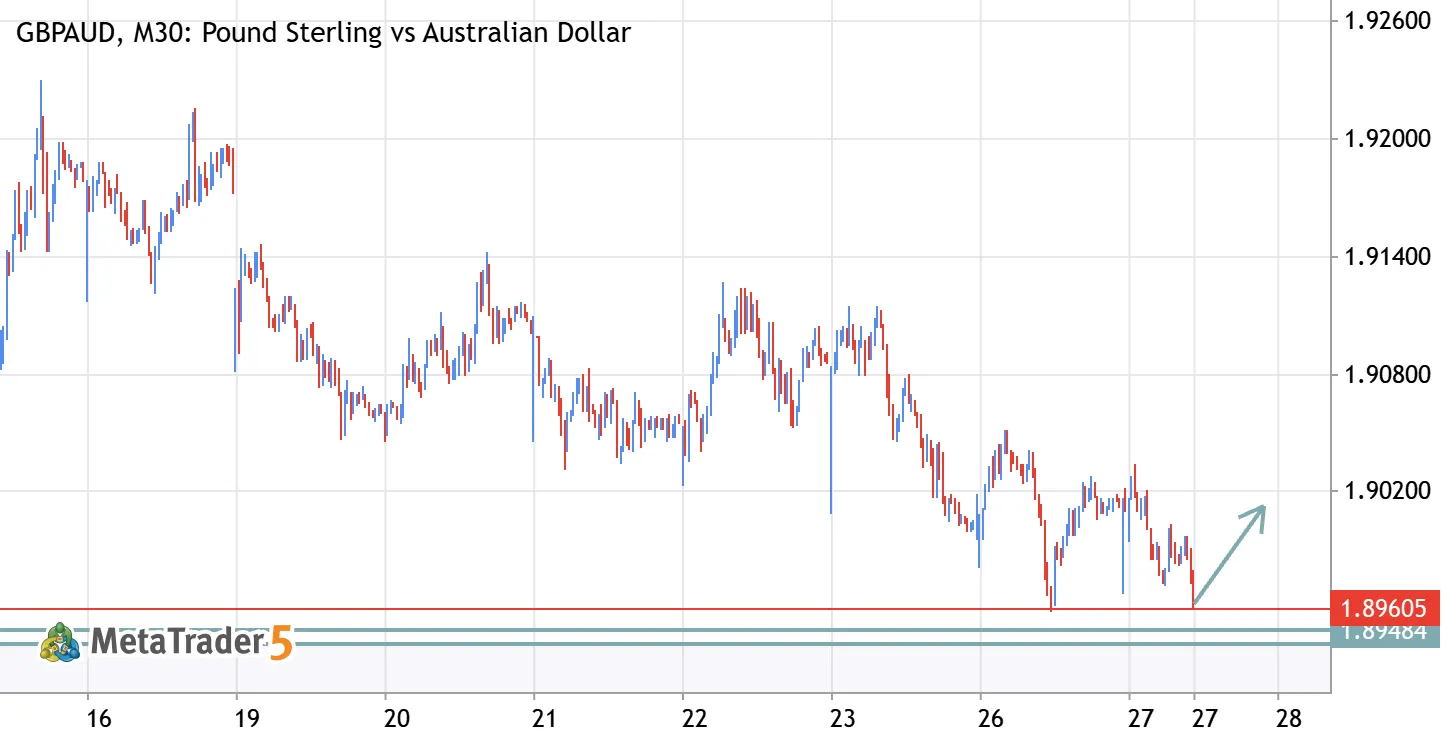
GBPAUD – Bullish Breakout Setup: Buyers Target Higher Levels GBPAUD Long Pound Sterling vs Australian Dollar

GBPAUD – Bullish Breakout Setup: Buyers Target Higher Levels

🟢 GBP/AUD Buy Signal Buy Entry: 1.89705 - 1.90120 Stop Loss: 1.89500 Take Profit 1: 1.89892 Take Profit 2: 1.90120 📚 Educational Market Idea: GBP/AUD presents a potential bullish setup from the 1.89705 entry level. If buyers maintain momentum and price action confirms bullish strength, the pair could advance toward 1.89892, followed by 1.90120. Watch for bullish confirmation, such as a strong bullish candle or a break above nearby resistance. If price moves against the setup and approaches the stop loss, follow your predefined risk-management plan. 📌 Trade Management: Consider securing partial profits at TP1 and allowing the remaining position to target TP2 if bullish momentum continues. Manage risk carefully and avoid increasing exposure impulsively. ⚠️ Risk Disclaimer: Forex trading
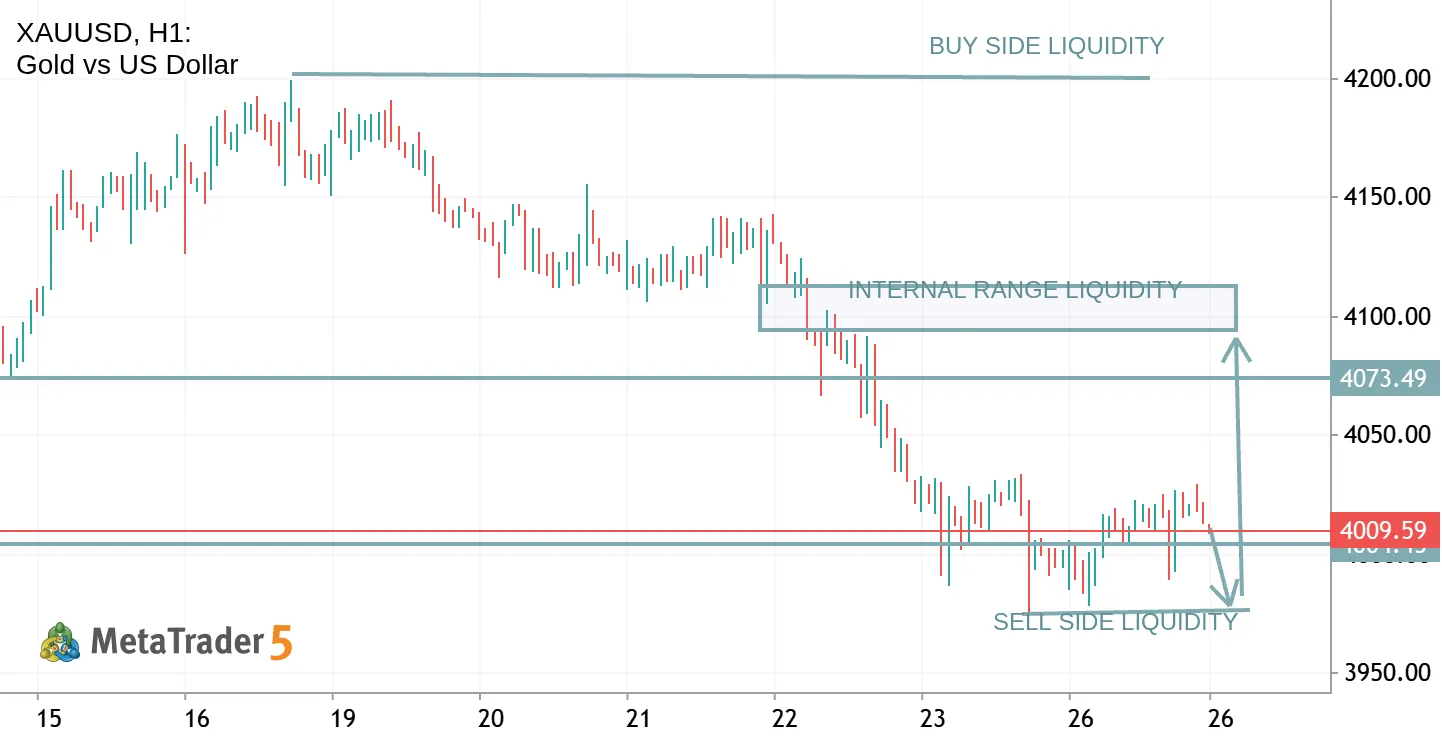
XAUUSD H1: Holding Above $4,000 — Order Blocks, Liquidity and FVG Into Fed Week XAUUSD Long Gold vs US Dollar

XAUUSD H1: Holding Above $4,000 — Order Blocks, Liquidity and FVG Into Fed Week

Gold reclaimed $4,000 on Monday after last week's roughly 4% drop, helped by softer oil, and is holding around $4,010 into Fed week. Fed decision 27-28 October and PCE 29 October are the key events ahead, so volatility around news should be expected and position size kept smaller. Structure and levels marked on this H1 chart: - Key level $4,000 — holding above it keeps the bounce intact; a daily close back below $3,946 would change that reading. - Buy-side liquidity above: $4,032, then $4,075 — highs where buy stops can rest and price can be drawn to. - Sell-side liquidity below: $3,975, then $3,946, then $3,890 — lows where sell stops can rest. - Bullish order block / demand: $3,975-$3,946 zone. - Bearish order block / supply: $4,032-$4,075 zone. - Fair Value Gap: $4,000-$4,004 area, as
#US500: Buyers Defend Key Support Again — But for How Long? 500 US500 US SPX 500 Index

#US500: Buyers Defend Key Support Again — But for How Long?

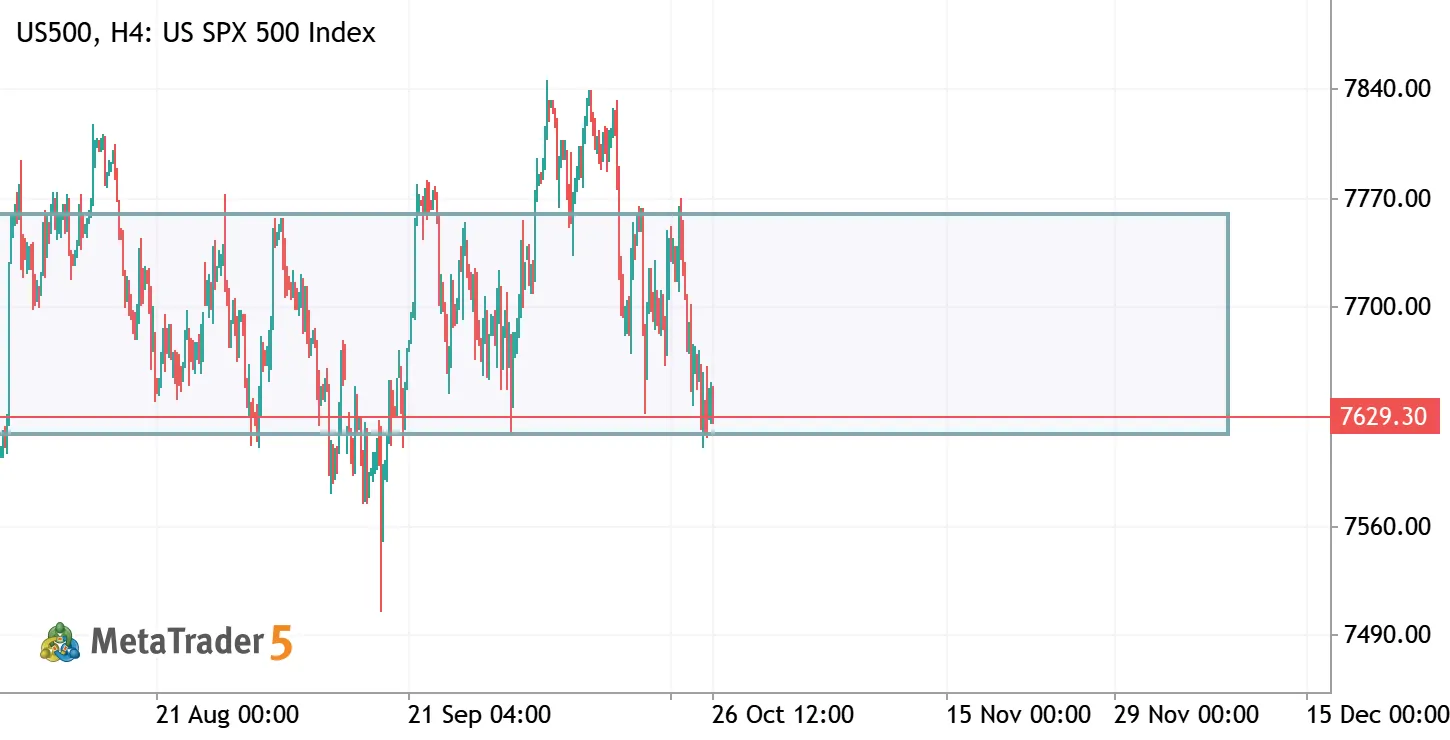
The S&P 500 continues to trade within a wide sideways range. After another failed attempt to hold near the upper boundary, sellers regained control and pushed the index back toward the key support area around 7620–7630. Despite the recent decline, it is still too early to confirm a broader bearish reversal. Two scenarios to watch: Bullish: Holding above 7620–7630 and recovering above 7700 could open the way for another test of 7760. Bearish: A confirmed break below 7620 would increase the probability of a deeper correction toward 7500–7380. In my view, waiting for confirmation is more important than trying to predict the next move. Will buyers defend this support once again, or is the market preparing for a deeper correction?
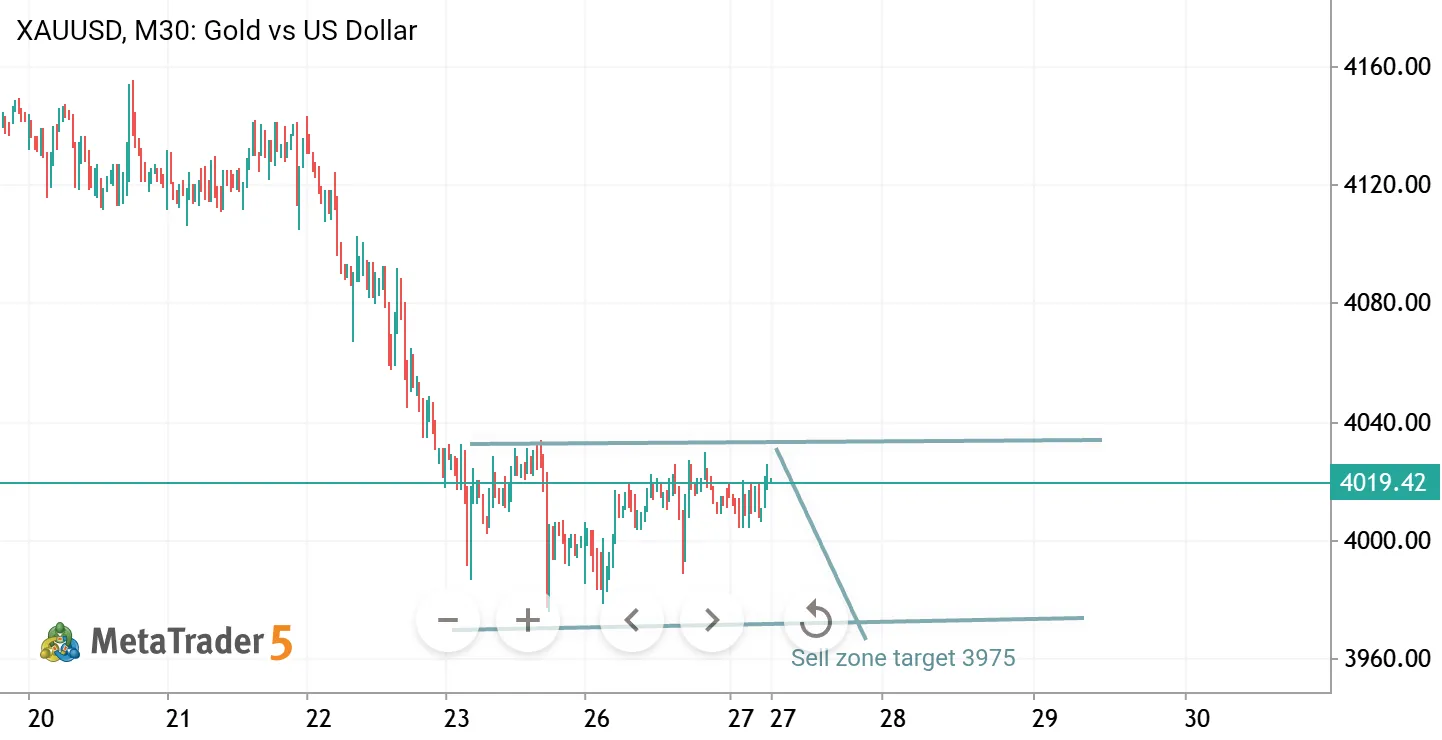
XAU/USD (Gold) – Resistance Battle: Will Gold Drop Toward 3950 XAUUSD Short Gold vs US Dollar

XAU/USD (Gold) – Resistance Battle: Will Gold Drop Toward 3950

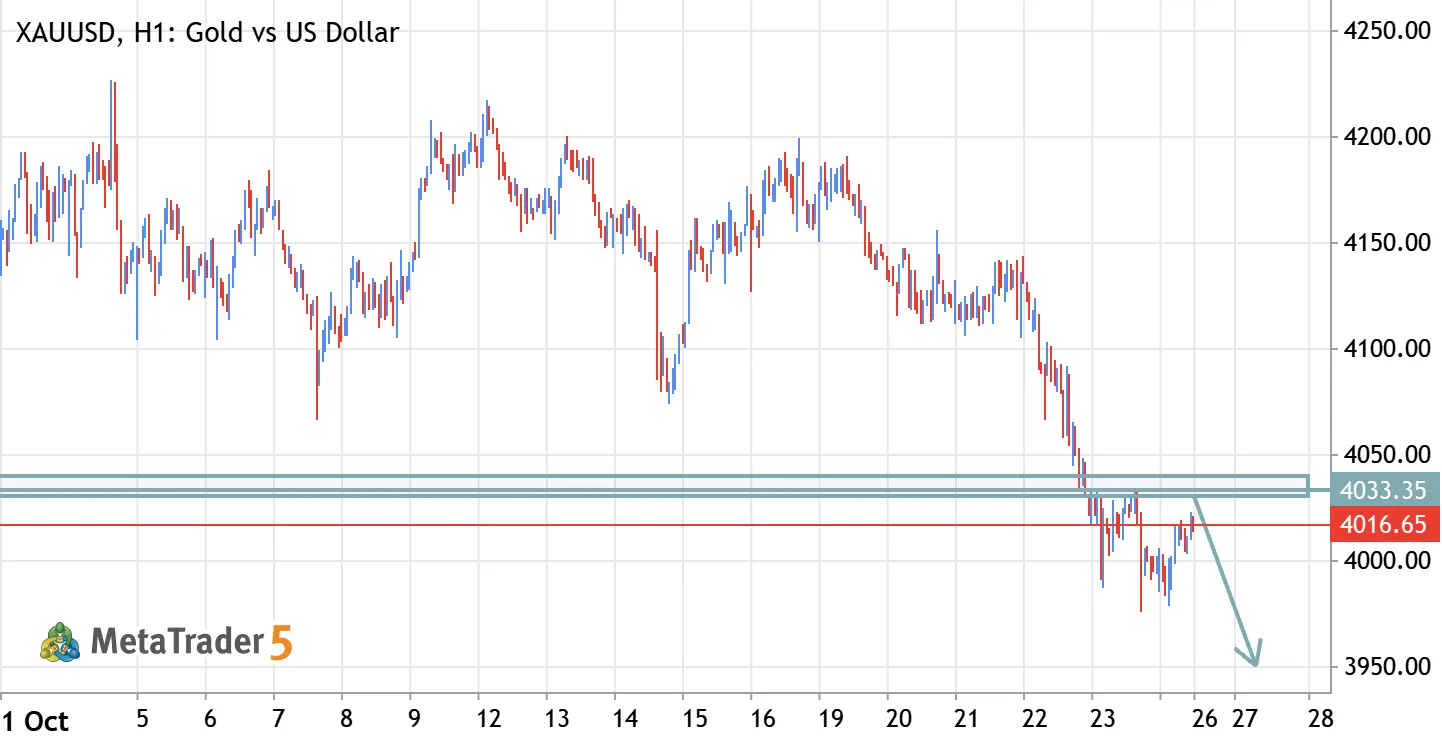
XAU/USD Sell Signal Sell Zone: 4030 – 4040 Stop Loss: 4060 Take Profit 1: 4010 Take Profit 2: 3970 Take Profit 3: 3950 Open Target: Open 📚 Educational Market Idea: Gold is approaching the 4030–4040 zone, where sellers may attempt to regain control if the area acts as resistance. A confirmed bearish reaction could push price toward 4010, followed by 3970 and 3950. If selling pressure strengthens, further downside may develop. Watch for bearish confirmation, such as a bearish engulfing candle, a failed breakout above the sell zone, or a break below nearby support before entering. 📌 Trade Management: Consider securing partial profits at TP1 and TP2 while protecting the remaining position as price moves in your favor. If bearish momentum continues, allow the remaining position to target TP3
AUDUSD – 0.7040 Resistance Wall: Sellers Target Pullback AUDUSD Short Australian Dollar vs US Dollar

AUDUSD – 0.7040 Resistance Wall: Sellers Target Pullback

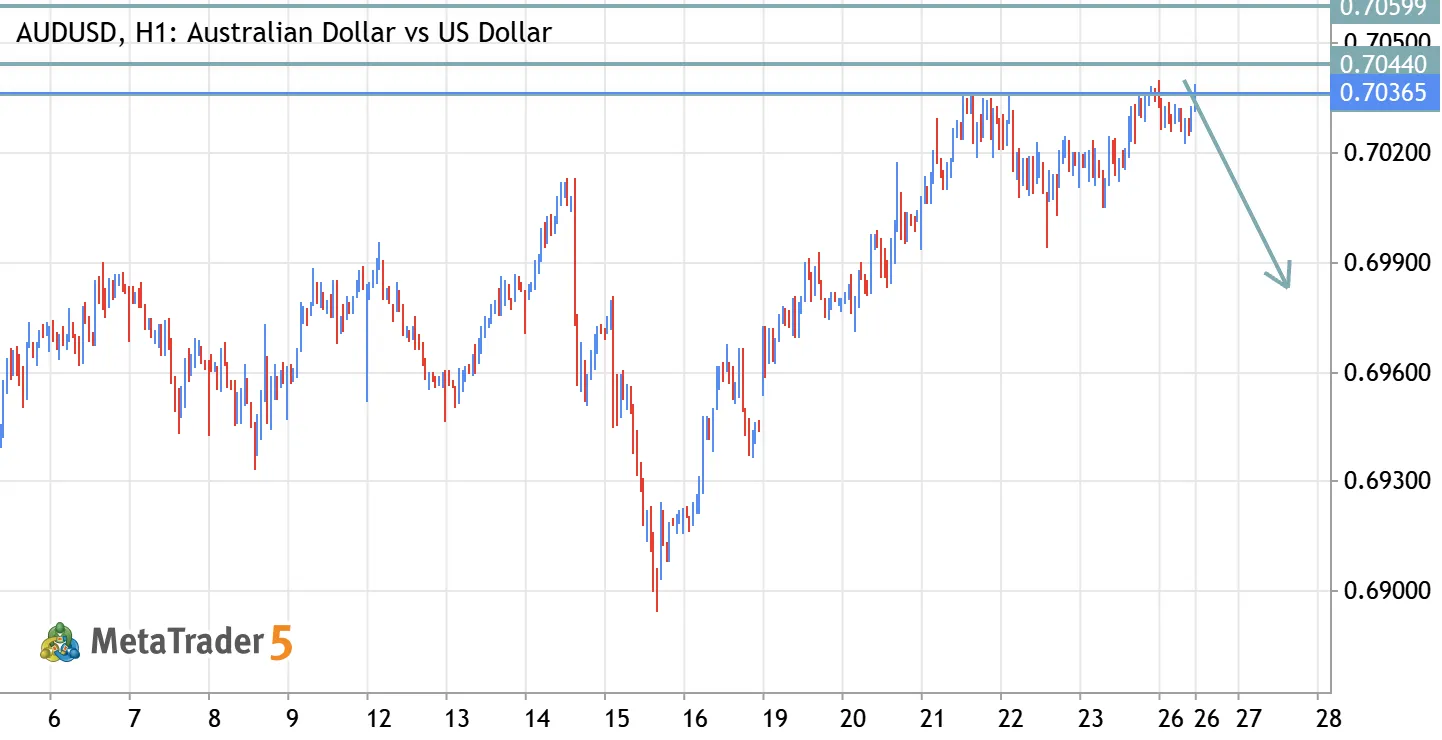
AUD/USD Sell Signal Sell Zone: 0.70310 – 0.70400 Stop Loss: 0.70580 Take Profit 1: 0.70110 Take Profit 2: 0.69830 Open Target: Open 📚 Educational Market Idea: AUD/USD is approaching the 0.70310–0.70400 zone, where selling pressure could emerge if the area acts as resistance. A bearish reaction from this zone may push price toward 0.70110, followed by 0.69830. If sellers maintain control and bearish momentum strengthens, further downside may follow. Watch for bearish confirmation, such as a bearish engulfing candle, a failed attempt to break above the sell zone, or a breakdown below nearby support before entering. 📌 Trade Management: Consider securing partial profits at TP1 and TP2 while protecting the remaining position as price moves in your favor. If bearish momentum continues, allow
XAUUSD 15M: Buy the Pullback to $4,000 After Gold Reclaims the Level XAUUSD Long Gold vs US Dollar

XAUUSD 15M: Buy the Pullback to $4,000 After Gold Reclaims the Level

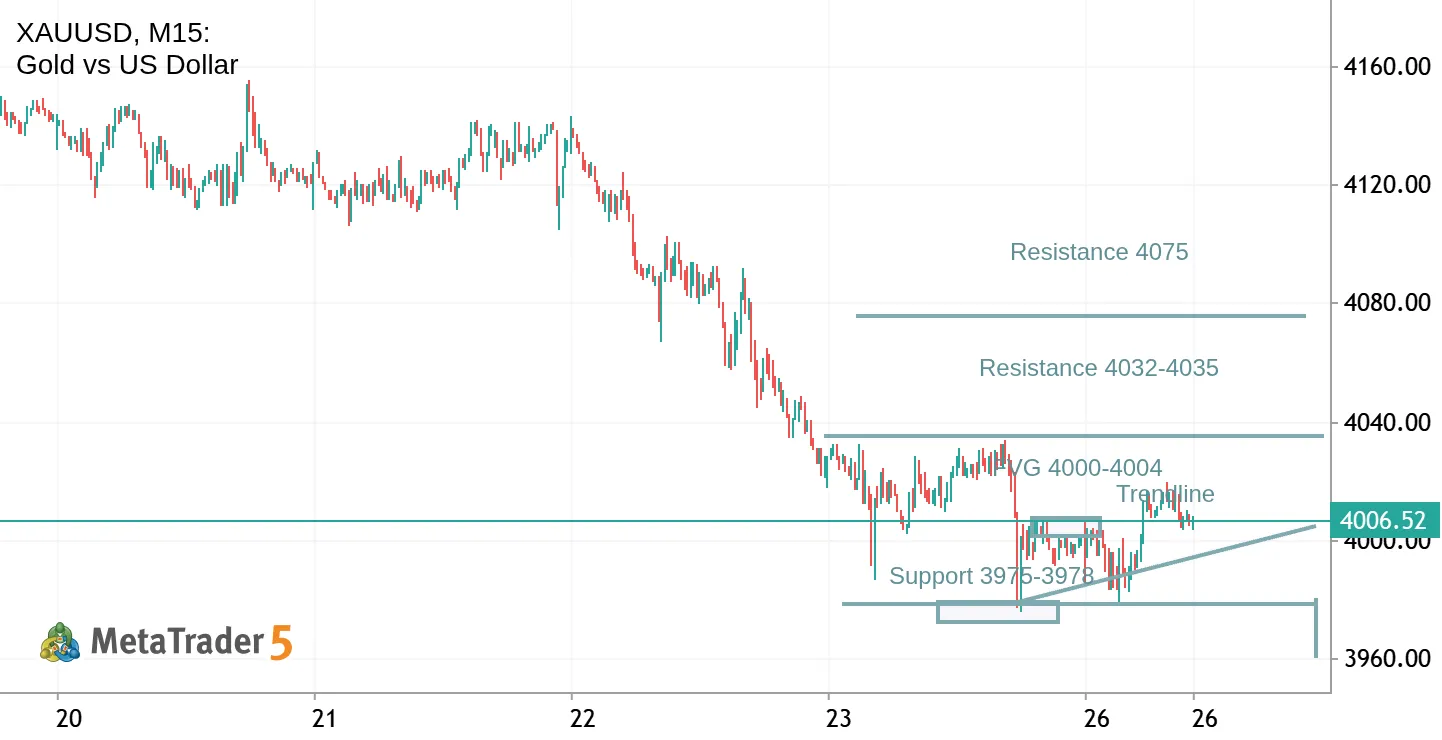
Intraday idea on XAUUSD, 15-minute timeframe, Monday 26 October 2026. Bias: LONG (buy) on a pullback, based on the 15-minute recovery structure. 15M structure: Gold made an intraday low near $3,977-$3,978 in Asia, then reclaimed $4,000 and held near $4,010-$4,012. On 15 minutes this is a short-term sequence of higher lows after the reclaim, while the Daily/4H trend is still bearish, so this is a counter-trend intraday idea with strict risk, not a long-term call. Levels marked for this idea: - Swing low: $3,975-$3,978 - Pullback / demand zone and FVG area to watch: $4,000-$4,004 - Trendline: rising 15M trendline from the $3,978 low, holding above $4,000 keeps the intraday recovery intact - Resistance / targets: $4,032-$4,035 first, then $4,075 if $4,035 breaks and holds - Invalidation: a
#XAUUSD - October 25, 2026 XAUUSD Short Gold vs US Dollar

#XAUUSD - October 25, 2026

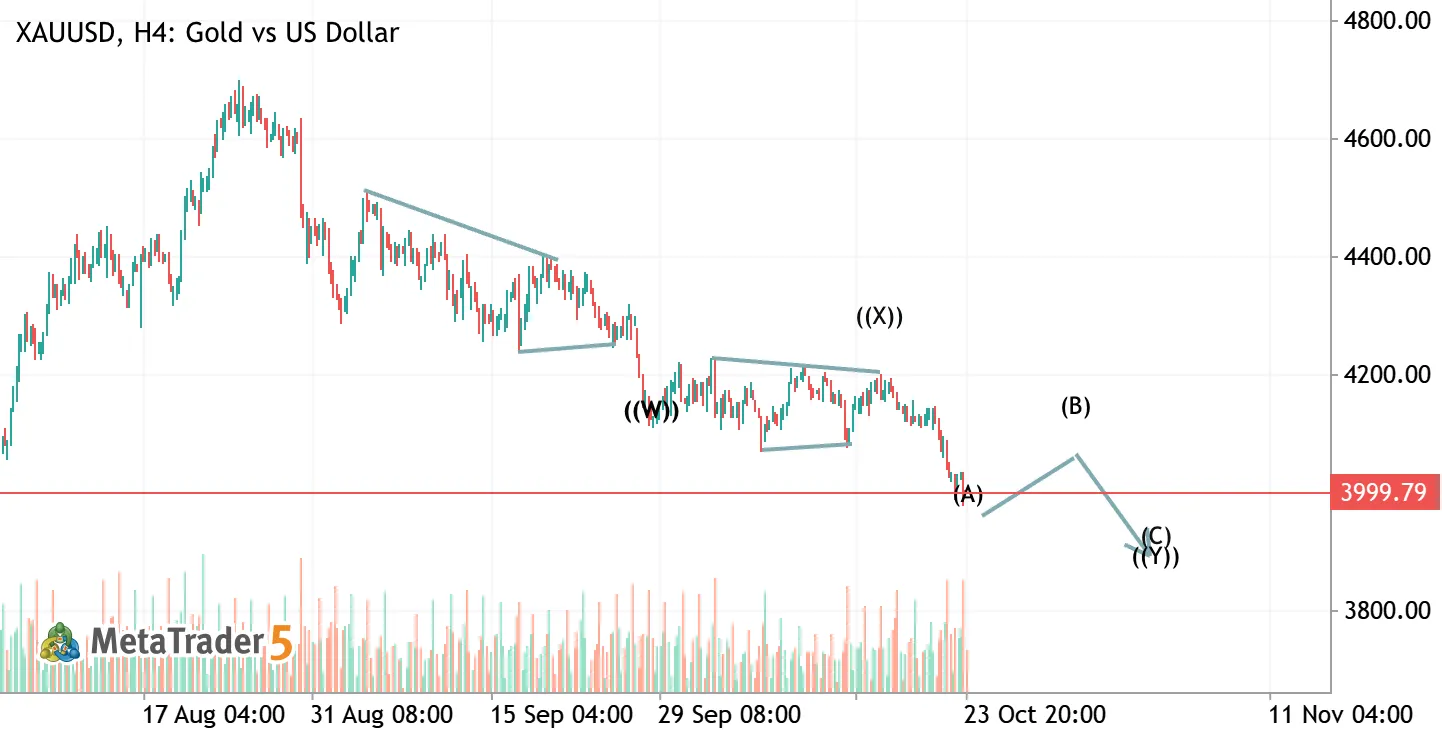
• Elliott Wave scenario on the H4 timeframe: A complex corrective structure (w)(x)(y) is forming. Price is currently developing wave (y)—potentially unfolding as a Zigzag. • Wave (x) as a triangle: This pattern acts as a redistribution zone, heavily supporting the scenario of further downside for Gold. • Daily timeframe perspective: The complex corrective sequence analyzed above is part of a larger diagonal wave structure, which belongs to a broader medium-term Zigzag pattern. (Note: This is an early projection based on current price action). • Projection: According to this scenario, the price could drop below the 3500 level. This structural development may take a considerable amount of time to play out, likely extending into early 2027. • Disclaimer: This analysis reflects a personal
Gold Daily Plan | Oct 22, 2026 XAUUSD Short Gold vs US Dollar

Gold Daily Plan | Oct 22, 2026

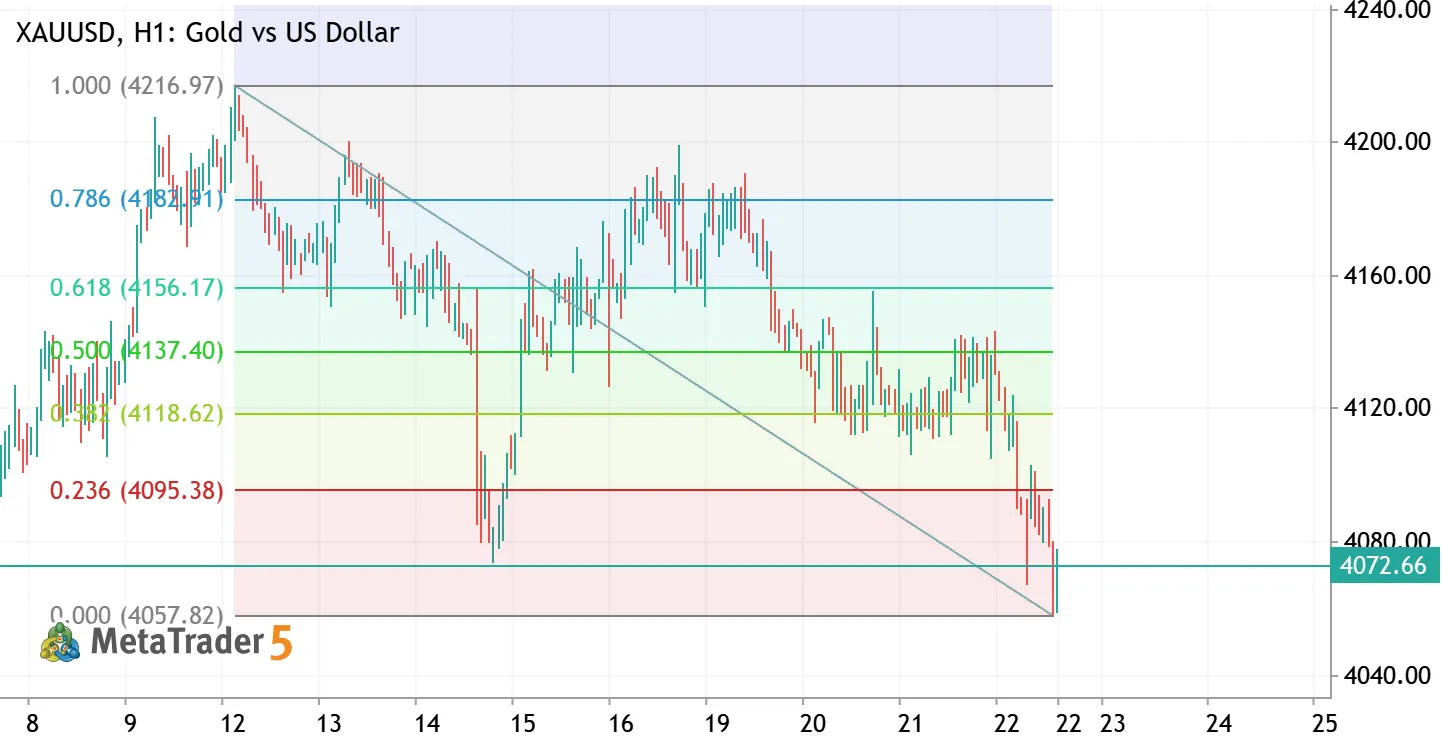
Gold Daily Plan | Oct 22, 2026 – Base broken, selling the pullback into 4095 **Recap:** Yesterday's long from 4124 hit TP1 (4140) ✅. After that, the 4105–4113 base gave way and gold dropped to a new low at 4057.55, below the Oct 14 low. On H1, that confirms the downtrend: lower highs and now a lower low. Fibonacci of the drop (4216.90 → 4057.55): - 0.236 → 4095.16 - 0.382 → 4118.42 - 0.500 → 4137.23 - 0.618 → 4156.03 **Fundamentals:** US jobless claims came in stronger than expected (194K vs 200K). A solid labor market keeps Fed hike expectations alive, which weighs on gold. **Plan:** The bias has flipped, so I'm not buying this bounce. I'd rather sell a pullback into **4095–4105**, where the 0.236 Fibonacci lines up with the broken support (now resistance). **Trade: SELL LIMIT XAUUSD