

NVDA
#1
NVIDIA Corporation - Common Stock
229.2 8 USD
-0.01%
Market Price
Sector: Technology
Base: USD
Profit Currency: USD
Daily Range
Year Range
Daily Change
-0.52%
Monthly Change
+8.62%
6 month change
+23.26%
Year Change
+21.98%
Previous Close
230.4 8
Open
233.8 8
Low
229.1 1
High
233.8 9
Financials
2026
Current report, Q2 FY2026
NVIDIA CORP current report, Q2 FY2026
8-K
Quarterly report, Q1 FY2027
NVIDIA CORP quarterly report, Q1 FY2027
10-Q
Current report, Q2 FY2026
NVIDIA CORP current report, Q2 FY2026
8-K
Institutional holdings, Q1 FY2026
NVIDIA CORP institutional holdings, Q1 FY2026
13F-HR
INFORMATION TABLE, Q1 FY2026
NVIDIA CORP INFORMATION TABLE, Q1 FY2026
INFORMATION TABLE
Current report, Q1 FY2026
NVIDIA CORP current report, Q1 FY2026
8-K
Current report, Q1 FY2026
NVIDIA CORP current report, Q1 FY2026
8-K
Annual report, FY2026
NVIDIA CORP annual report, FY2026
10-K
Current report, Q1 FY2026
NVIDIA CORP current report, Q1 FY2026
8-K
2025
Current report, Q4 FY2025
NVIDIA CORP current report, Q4 FY2025
8-K
News
CPI, PPI, And Q3 Earnings Soon, October Could End Roughly (NDX)
SpaceX, Telecom Sell-Off, Micron's A Grades, Steve Cress Origin Story
Microsoft Is Taking AI Beyond the Data Center, But Its Surface Business Is Just a Small Piece of the Pie
Applied Digital Ends the Quarter With $36 Billion in Contracted Revenue as AI Moat Widens
CoreWeave Just Landed a Massive New AI Opportunity. Wall Street Sees 59% Upside Ahead.
Wall Street Bruch: Start Your Earnings Engines (NYSE:JPM)
Micron Stock Price Forecast — Bull Case Sees 191%+ Upside Ahead Despite Recent Pullback - TipRanks.com
Dan Ives Calls SpaceX’s $40B Nvidia Chip Debt Plan a ‘Smart Move’
Nvidia Stock: Finding New Ways To Extend The AI Growth Runway (NASDAQ:NVDA)
YNVD:CA: Solid Nvidia-Based Options Income ETF Idea For Canadian Investors (NEOE:YNVD:CA)
We’re about to get a huge read on whether earnings can keep propping up the stock market
Charts & Ideas
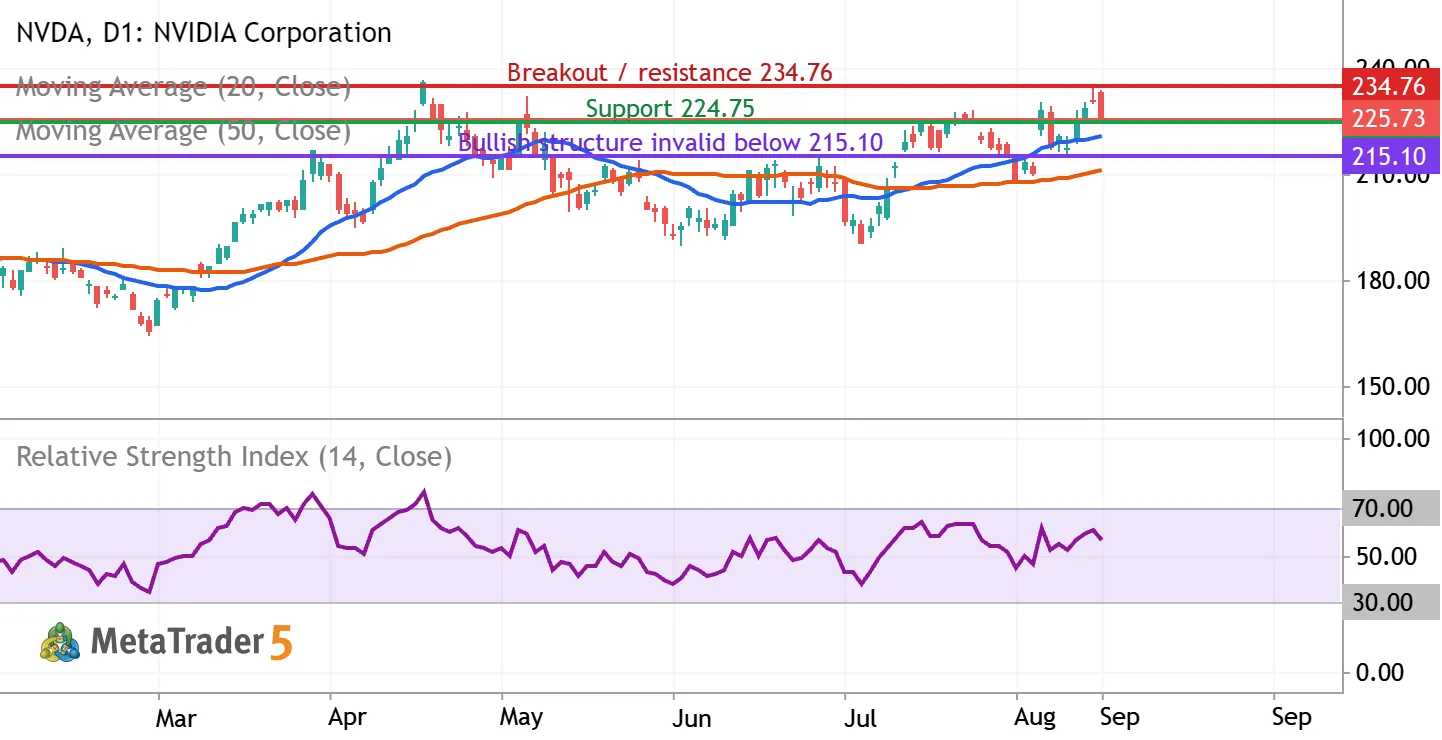
NVDA: testing $225 support as the uptrend meets $234.76 resistance
NVIDIA (NASDAQ: NVDA) | Daily chart | September 9, 2026 Bias: conditionally bullish over the next 2–6 weeks. Entry confirmation is still required. The latest completed regular session, September 8, closed at $225.73, down 2.01%, after reaching $233.71 intraday. The close near the session low signals selling pressure despite the broader recovery. What the indicators show The chart includes a blue 20-day simple moving average, an orange 50-day simple moving average, and purple RSI(14), all calculated from closing prices. At the latest completed candle, MetaTrader showed the averages near $220.48 and $211.22, with RSI near 56.19. Price remains above both rising averages, and the 20-day average is above the 50-day average. RSI above 50 supports positive momentum, but its reading below 70 is


The NVDA doesn’t have other trading ideas at this time
Browse ready-made trading ideas or select a symbol and create your own
Go to Charts and Trading Ideas