XAUUSD H1 ANALYSIS XAUUSD Gold vs US Dollar
XAUUSD H1 ANALYSIS
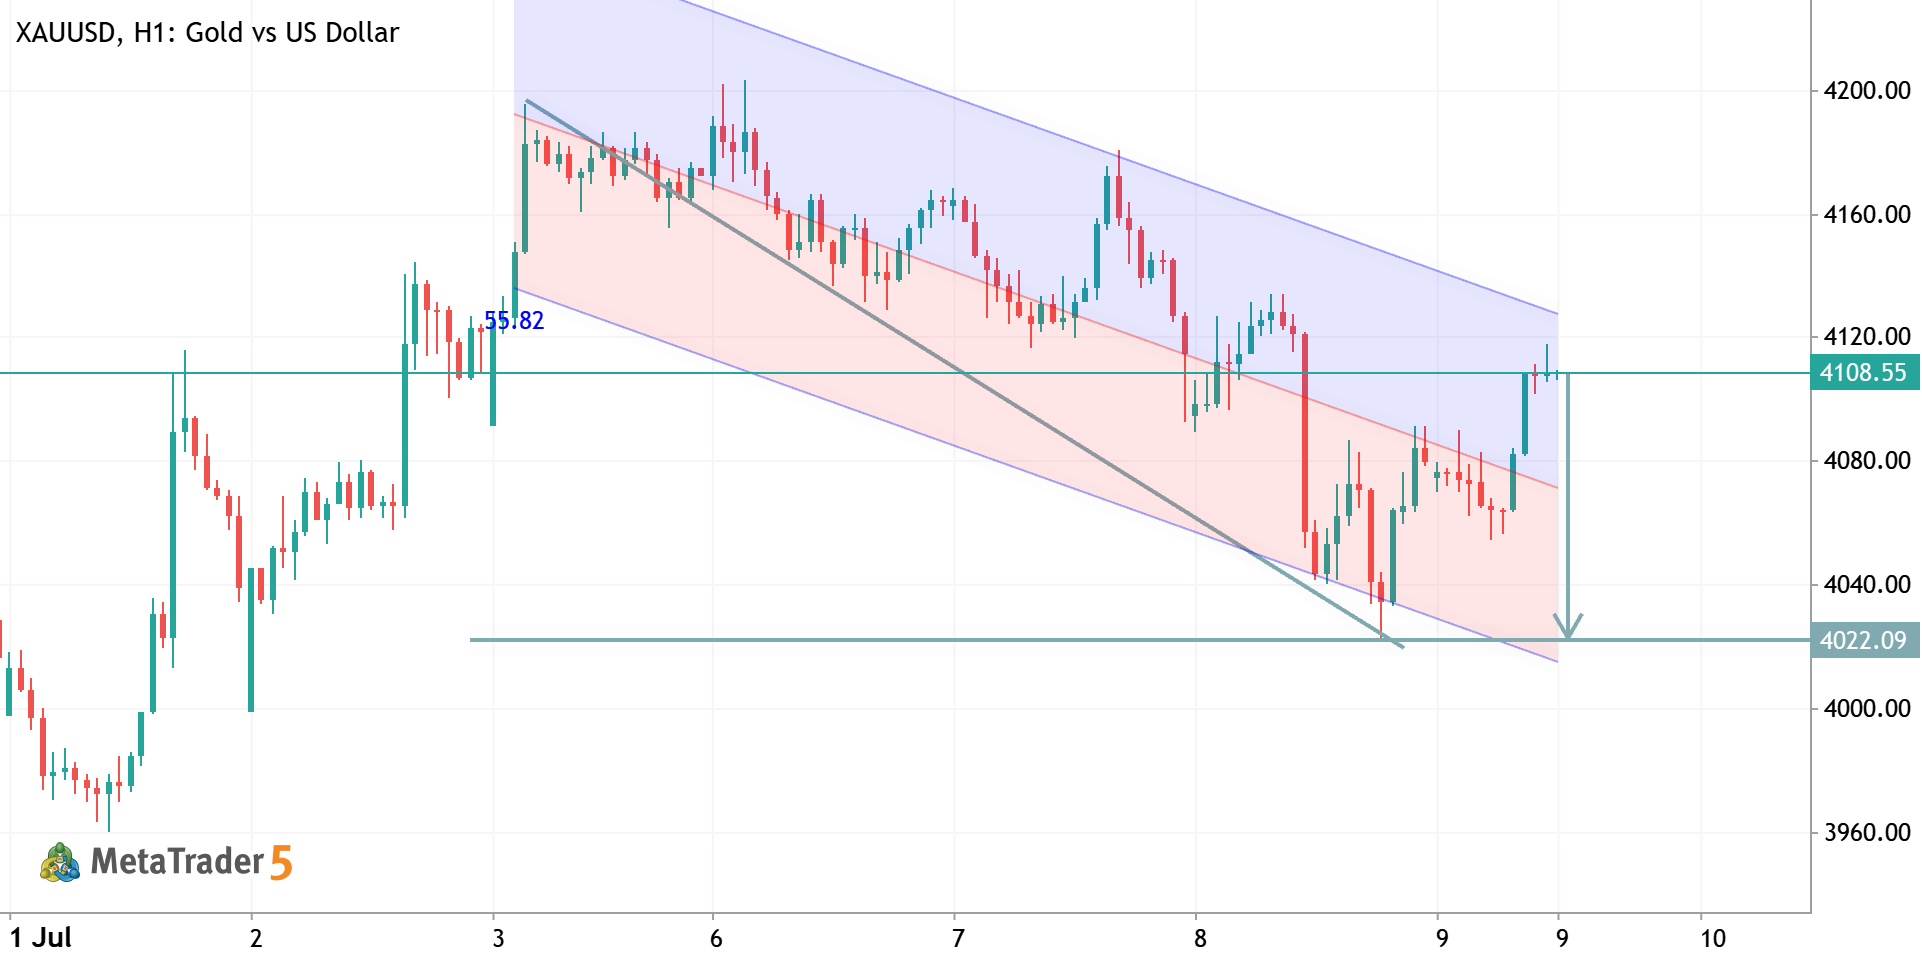
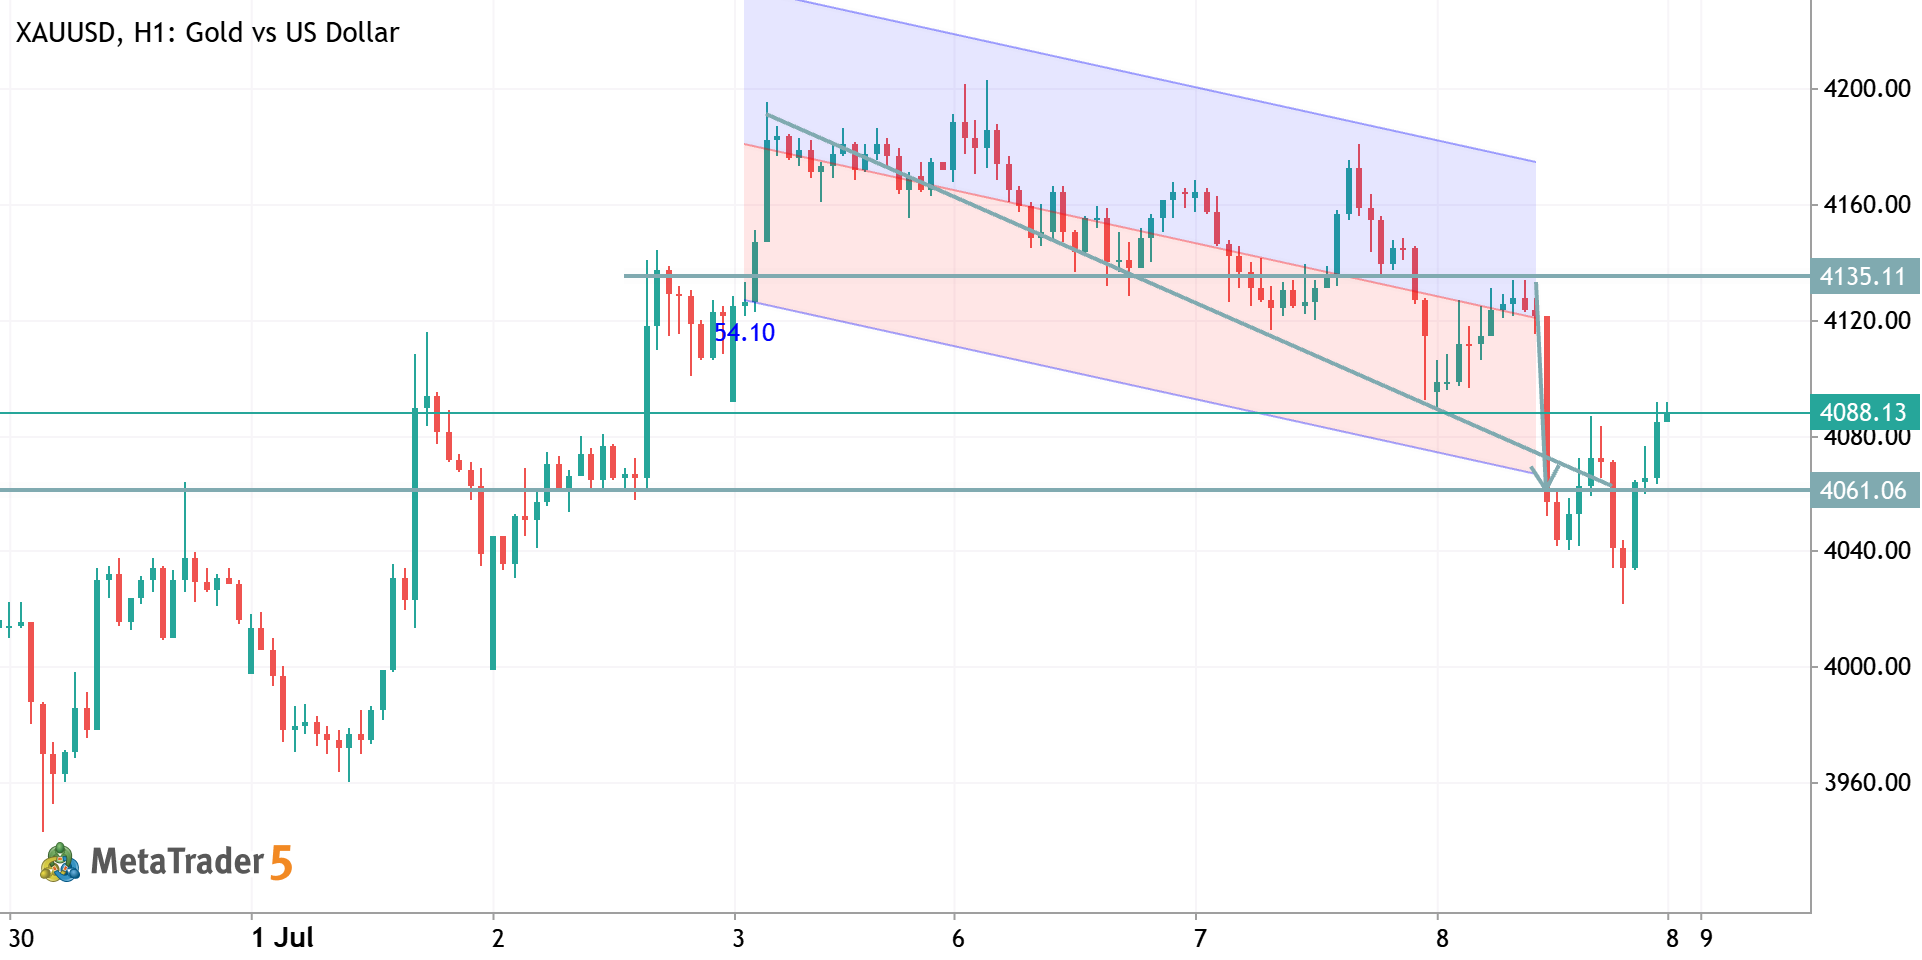
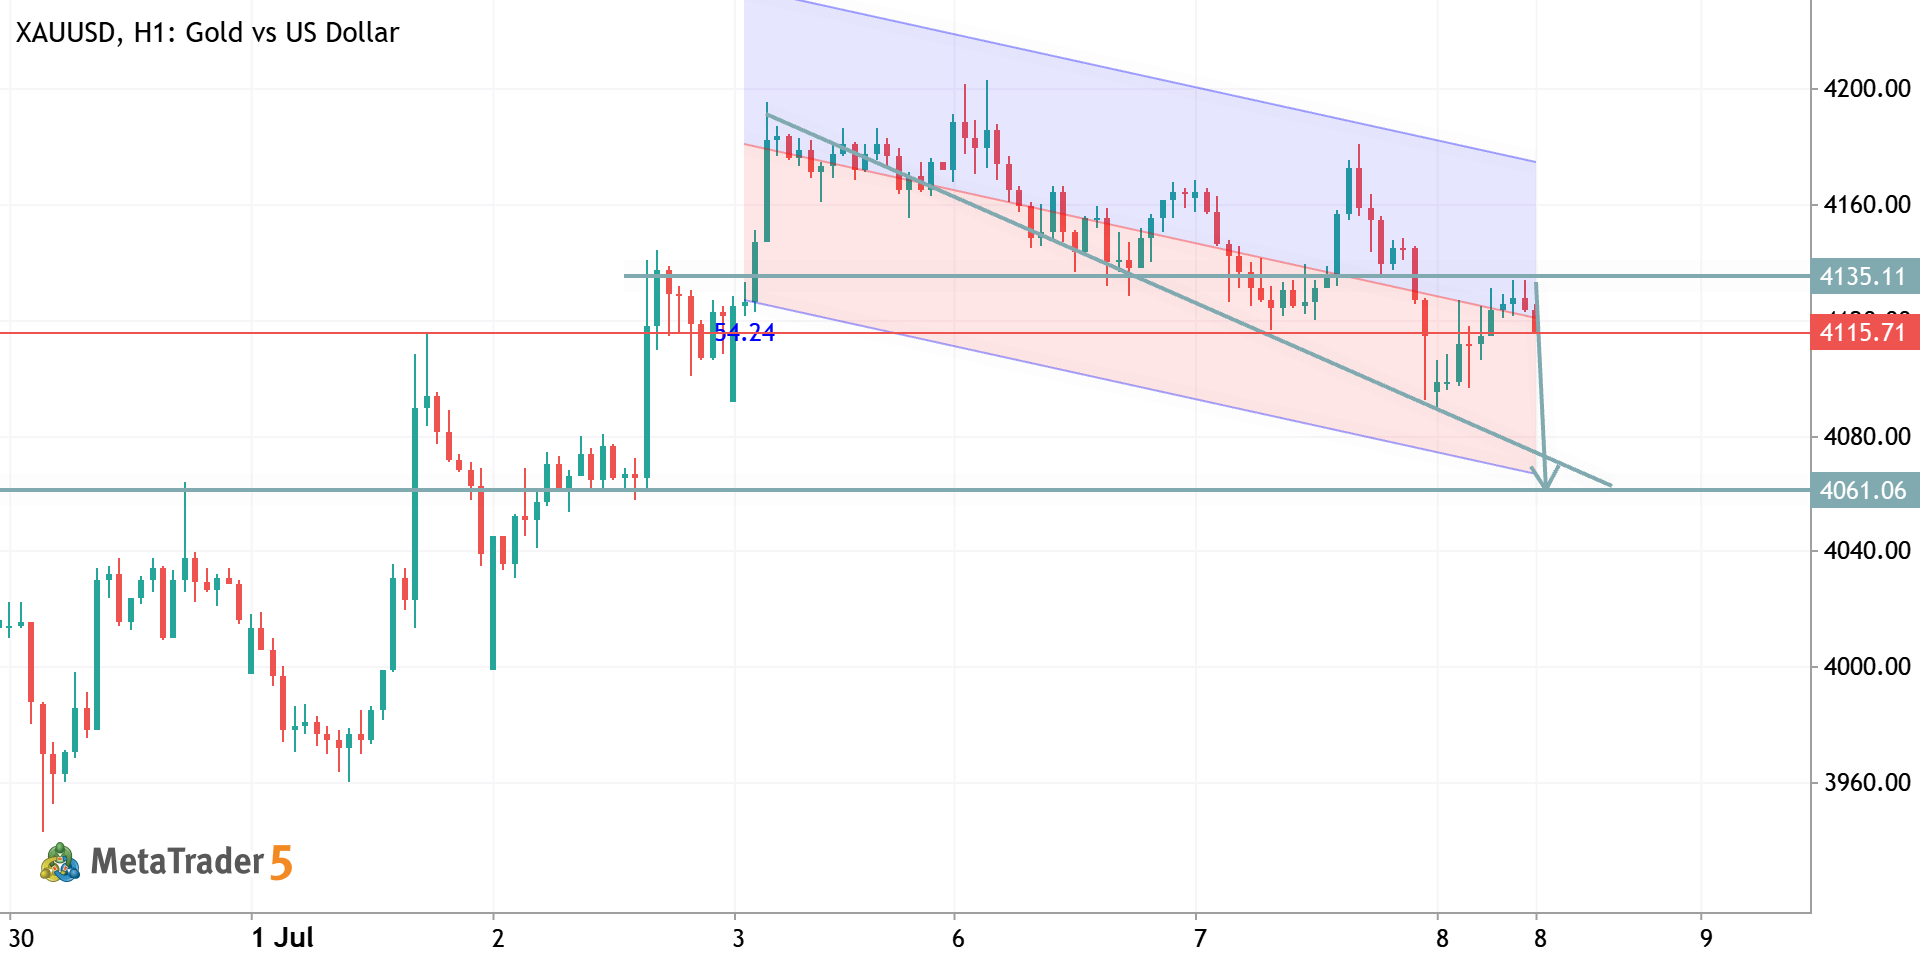
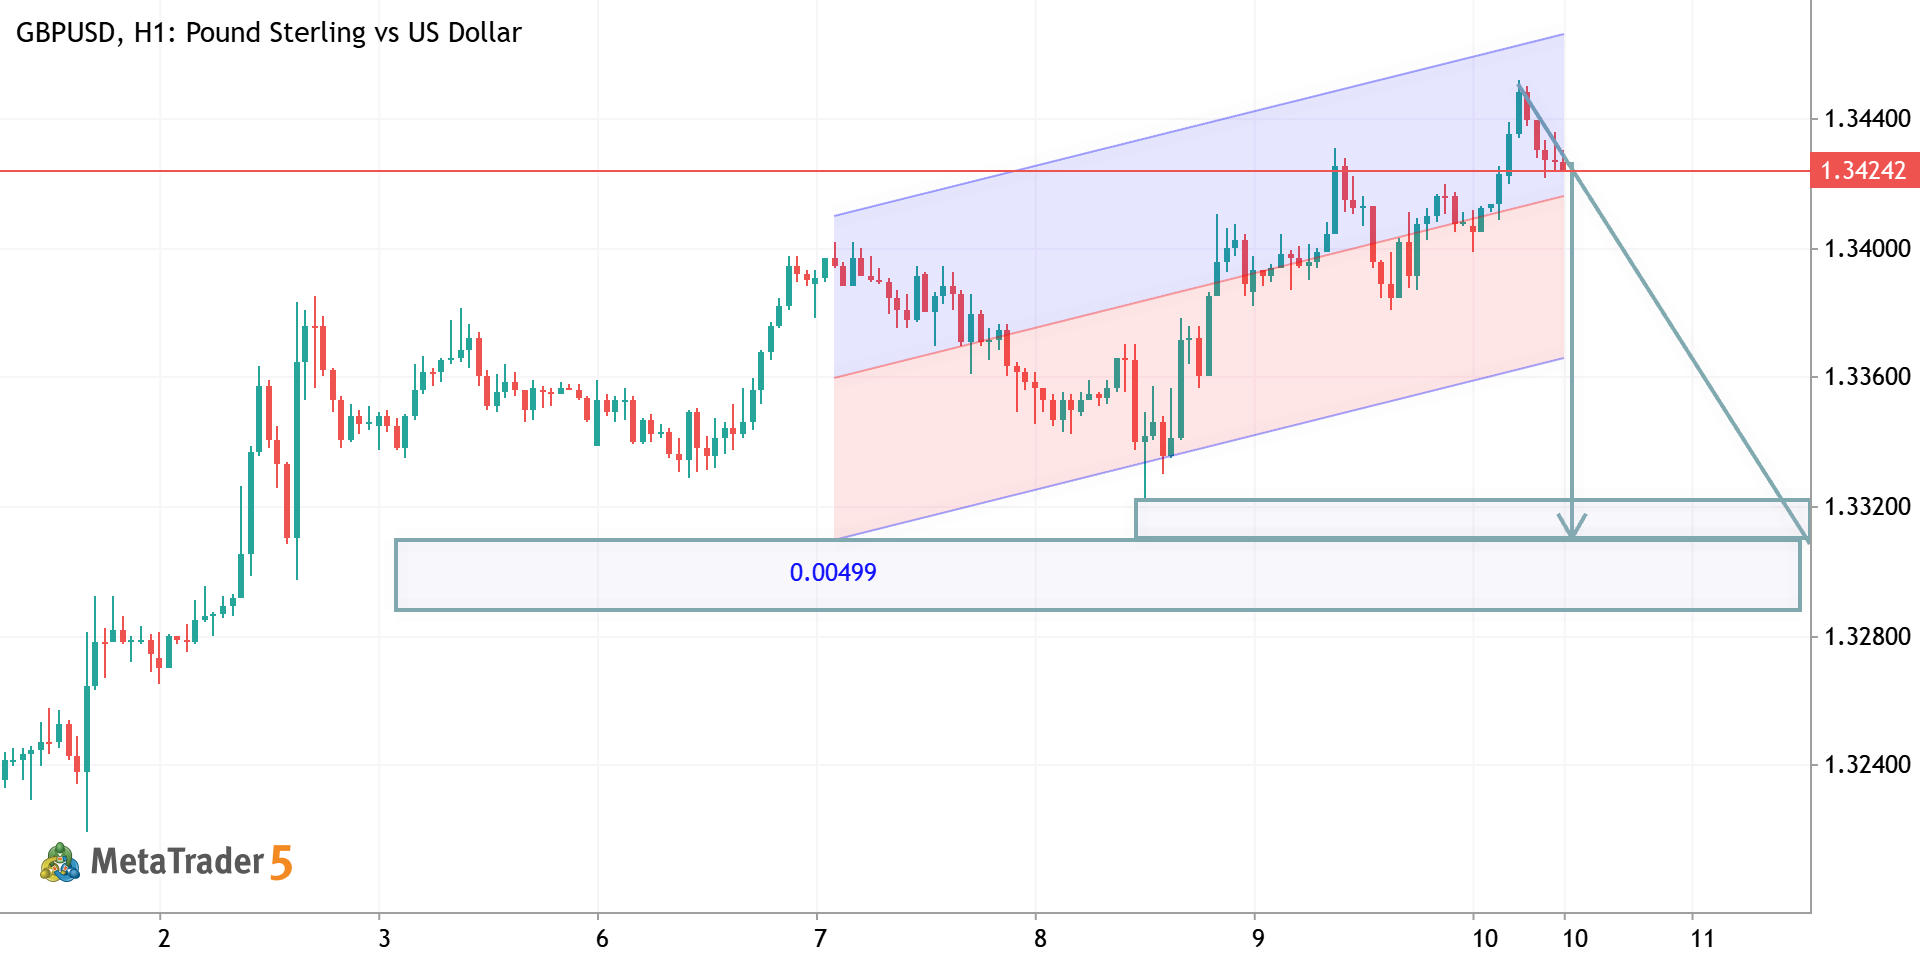
XAUUSD Analysis 📉 Price is testing the upper boundary of a descending channel after a strong rebound. As long as resistance around 4100–4115 holds, a rejection could trigger a move back toward the 4020 support zone. A confirmed breakout above the channel would invalidate the bearish outlook and open the door for further upside. Bias: Bearish below 4115 | Target: 4020 | Invalidation: Strong close above the channel resistance.
1
Goldanalysisteam Abdul Qayoom 2026.07.09 09:25
XAUUSD TRADE IDEA XAUUSD Long Gold vs US Dollar
XAUUSD TRADE IDEA
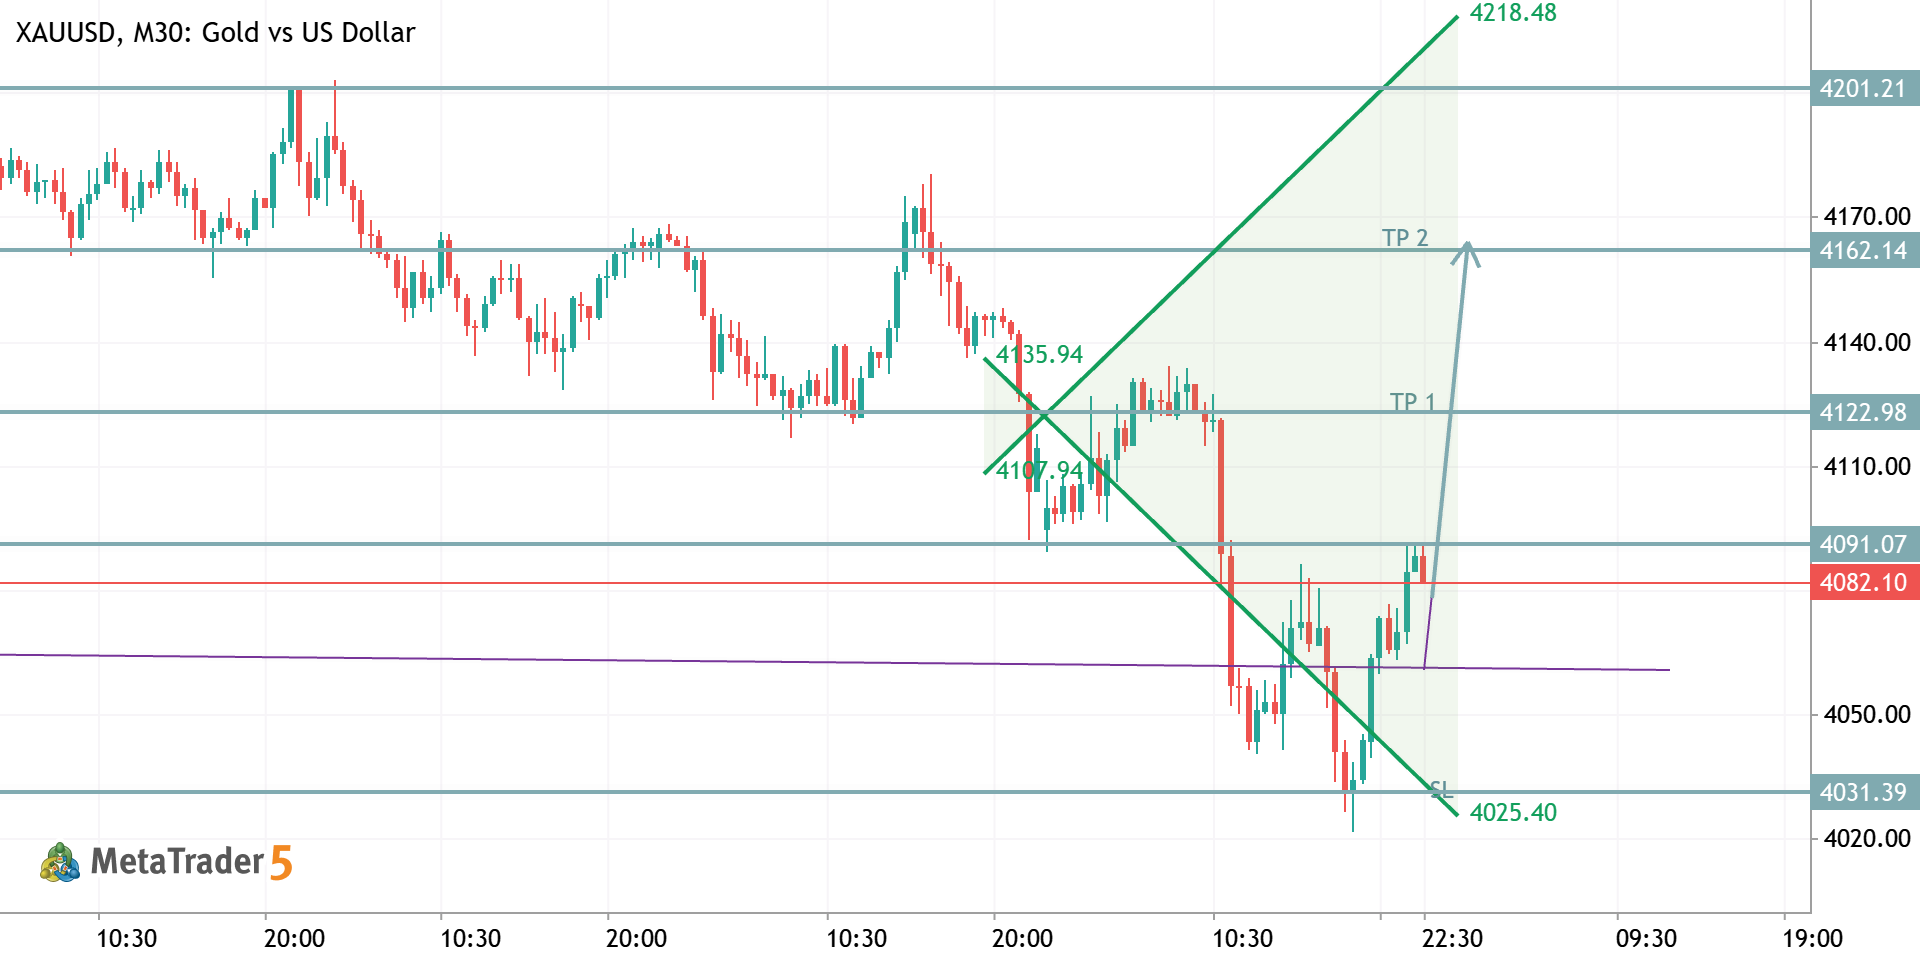
XAUUSD (Gold) M30 Trade Analysis Bias: BUY (Bullish Recovery) Price rejected the 4025–4035 support zone and formed a strong bullish rebound. The descending trendline has been broken, indicating weakening bearish momentum. Price is attempting to reclaim the 4087 resistance. A sustained close above this level strengthens the bullish outlook. Buy Entry: 4085–4090 (after confirmation with a bullish candle) Stop Loss: Below 4025 Take Profit 1: 4123 Take Profit 2: 4162 Extended Target: 4201–4218 if bullish momentum continues. Invalidation: A close below 4025 would invalidate the bullish setup and increase the probability of further downside. Conclusion: The chart currently favors buy opportunities while price remains above 4025 . A confirmed breakout above 4087 could lead to a move toward 4123
1
HamadJatoi Hamad Jatoi 2026.07.08 19:48
XAUUSD M30 TRADE ANALYSIS IDEA XAUUSD Gold vs US Dollar
XAUUSD M30 TRADE ANALYSIS IDEA
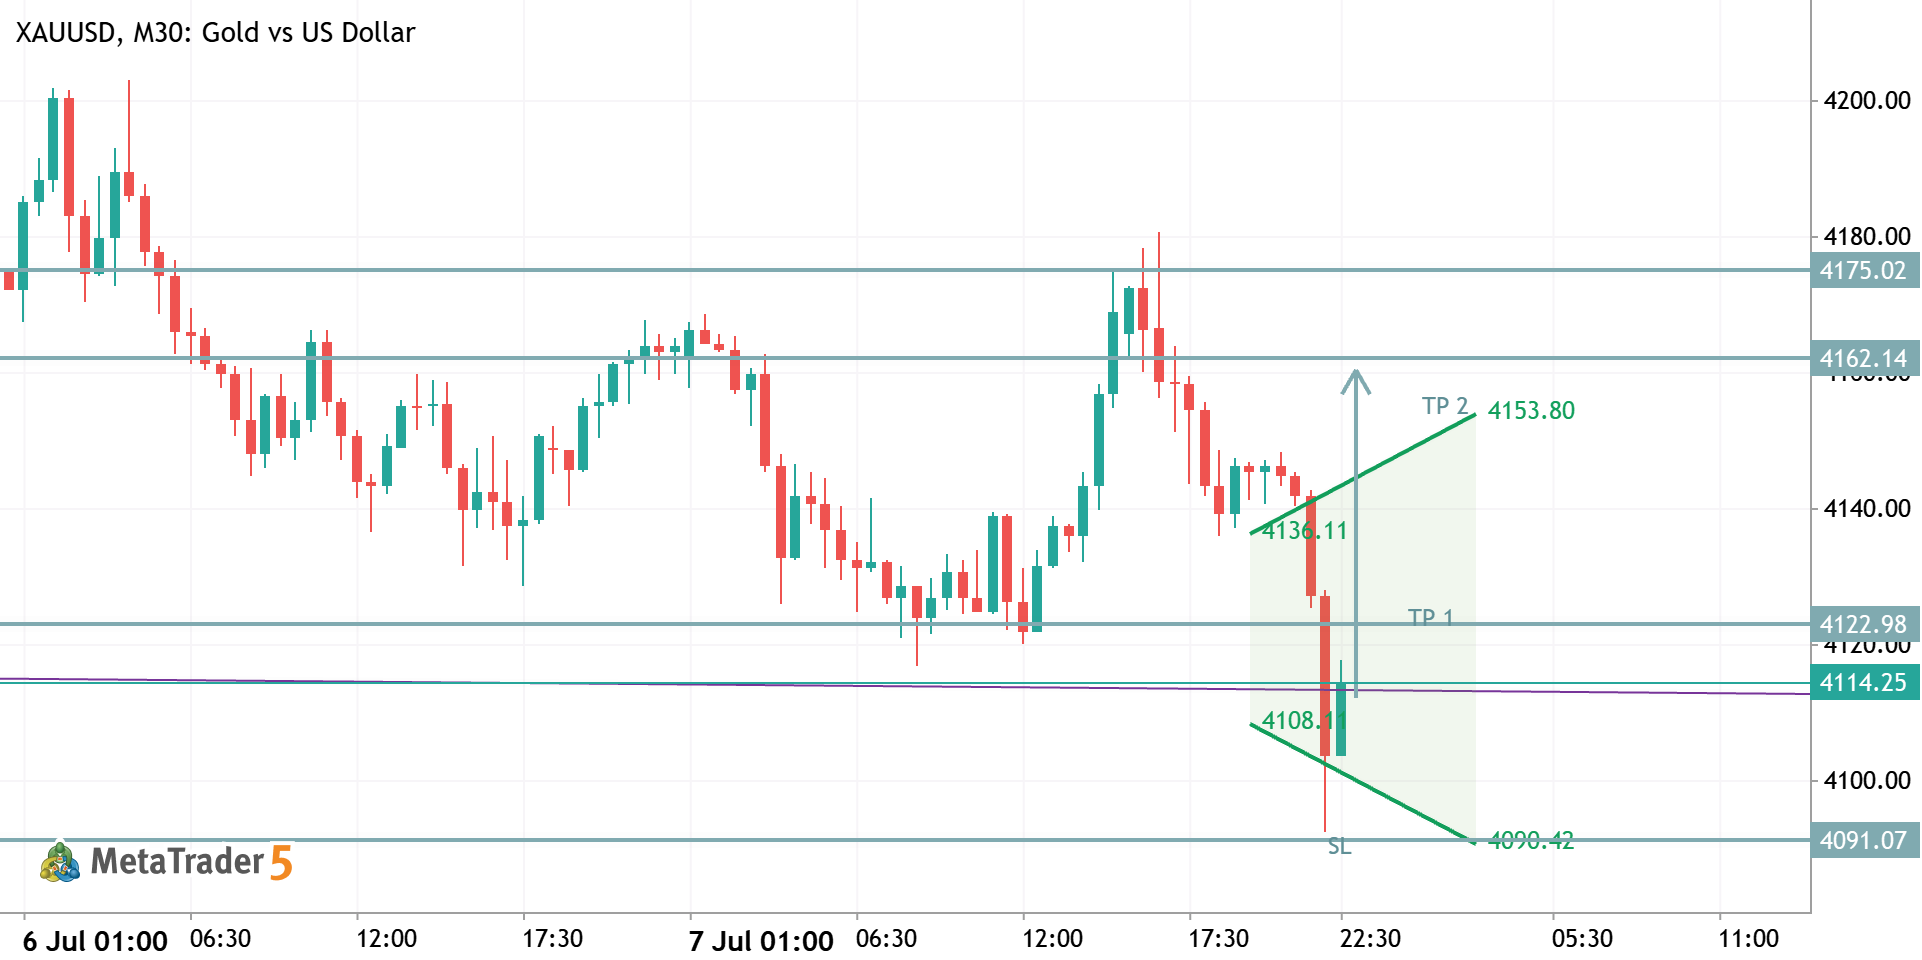
XAUUSD (Gold) – M30 Trade Analysis Market Bias: Short-term Buy (Counter-Trend Bounce) The chart shows a strong bearish impulse into the 4091–4100 support zone , followed by a sharp rejection candle, indicating buyers are defending this area. Buy Setup Entry: 4108–4115 (after bullish confirmation) Stop Loss: Below 4090 Take Profit 1: 4123 Take Profit 2: 4154 Extended Target: 4162 if bullish momentum continues Short Setup If price fails to hold above 4114–4123 and forms a bearish rejection: Sell Entry: 4120–4125 Stop Loss: Above 4138 Take Profit 1: 4100 Take Profit 2: 4091 Extended Target: 4080 if support breaks Key Levels Support: 4091, 4100 Resistance: 4123, 4162, 4175 Conclusion: The immediate bearish move appears exhausted after the rejection from support. A buy toward 4123–4154 has a
0
HamadJatoi Hamad Jatoi 2026.07.07 20:08
GBPUSD TRADE IDEA GBPUSD Long Pound Sterling vs US Dollar
GBPUSD TRADE IDEA
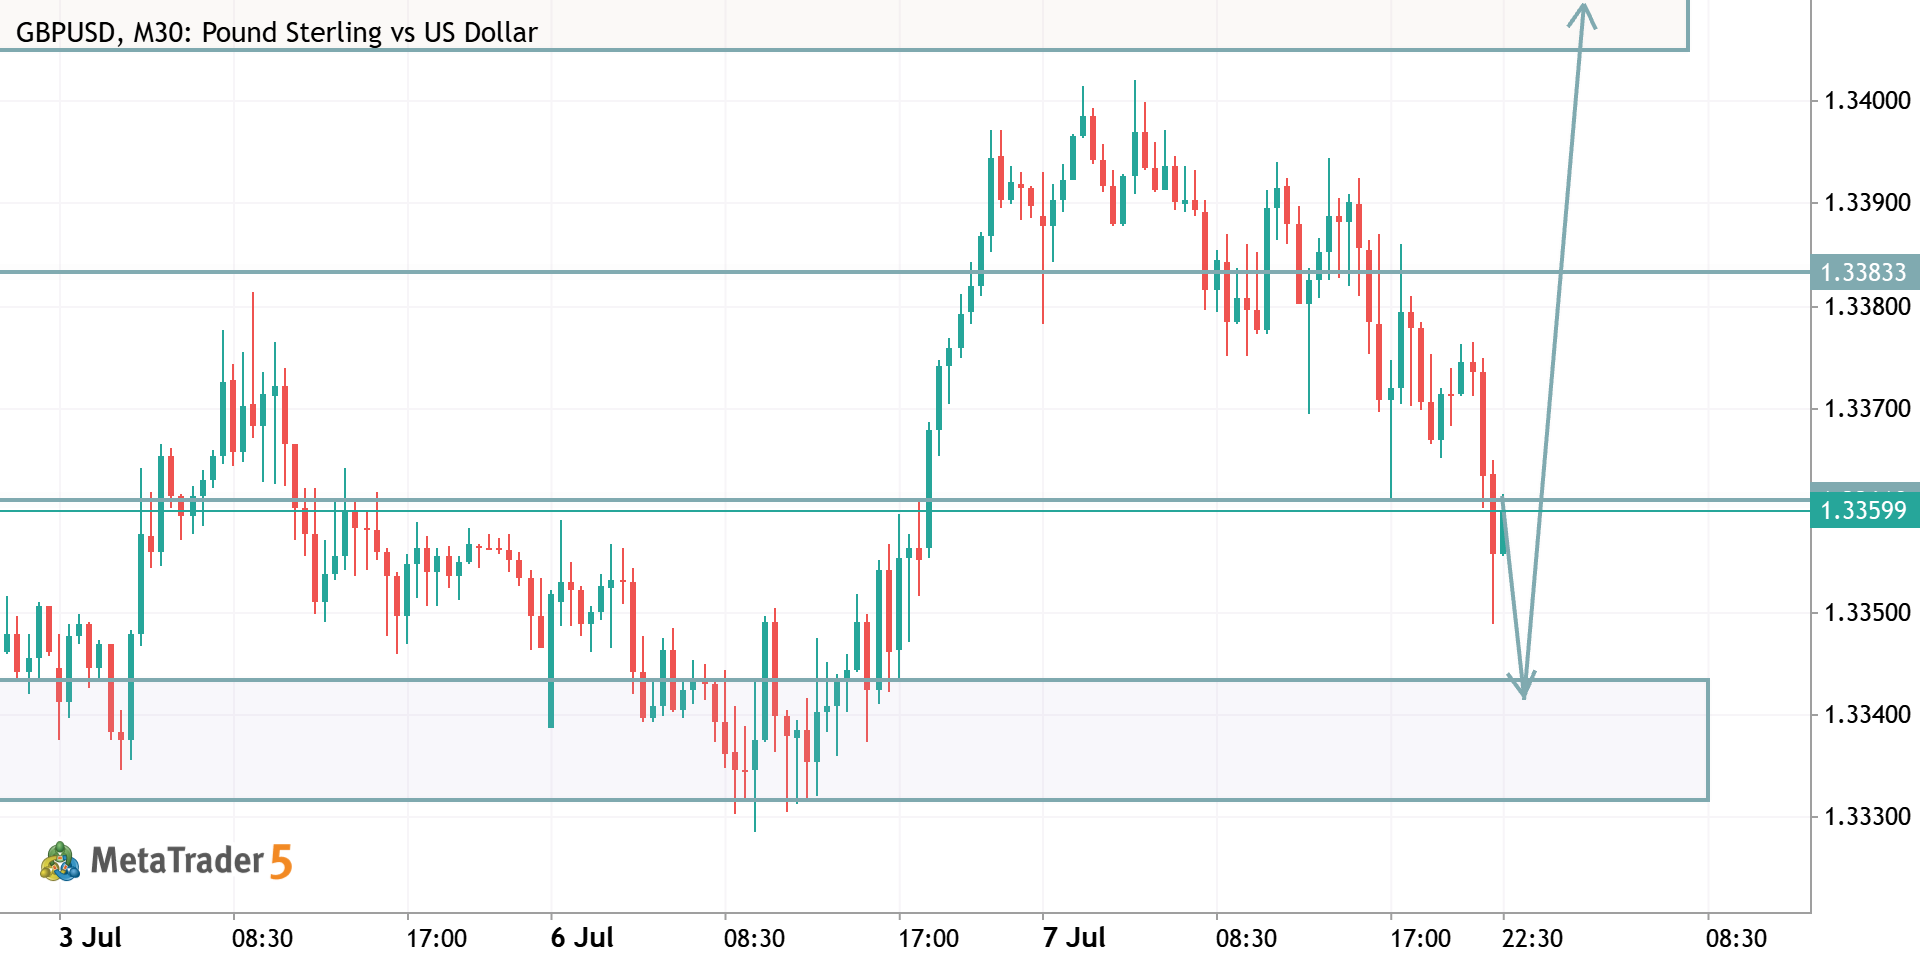
Bias: Bullish only if support holds. Support Zone: 1.3340 – 1.3330 Buy Entry: Wait for price to reject 1.3340 – 1.3330 with a bullish engulfing candle, strong bullish pin bar, or higher-low formation. Stop Loss: Below 1.3325 Take Profit 1: 1.3360 Take Profit 2: 1.3383 Take Profit 3: 1.3405 (if price breaks above resistance with strong momentum) Confirmation: Do not buy while price is still falling. Wait for a clear bullish reversal signal at the support zone before entering. A break below 1.3330 invalidates the buy setup and increases the probability of further downside.
0
HamadJatoi Hamad Jatoi 2026.07.07 19:52
MRNA - Long-Term Technical Forecast MRNA Moderna, Inc. - Common Stock
MRNA - Long-Term Technical Forecast
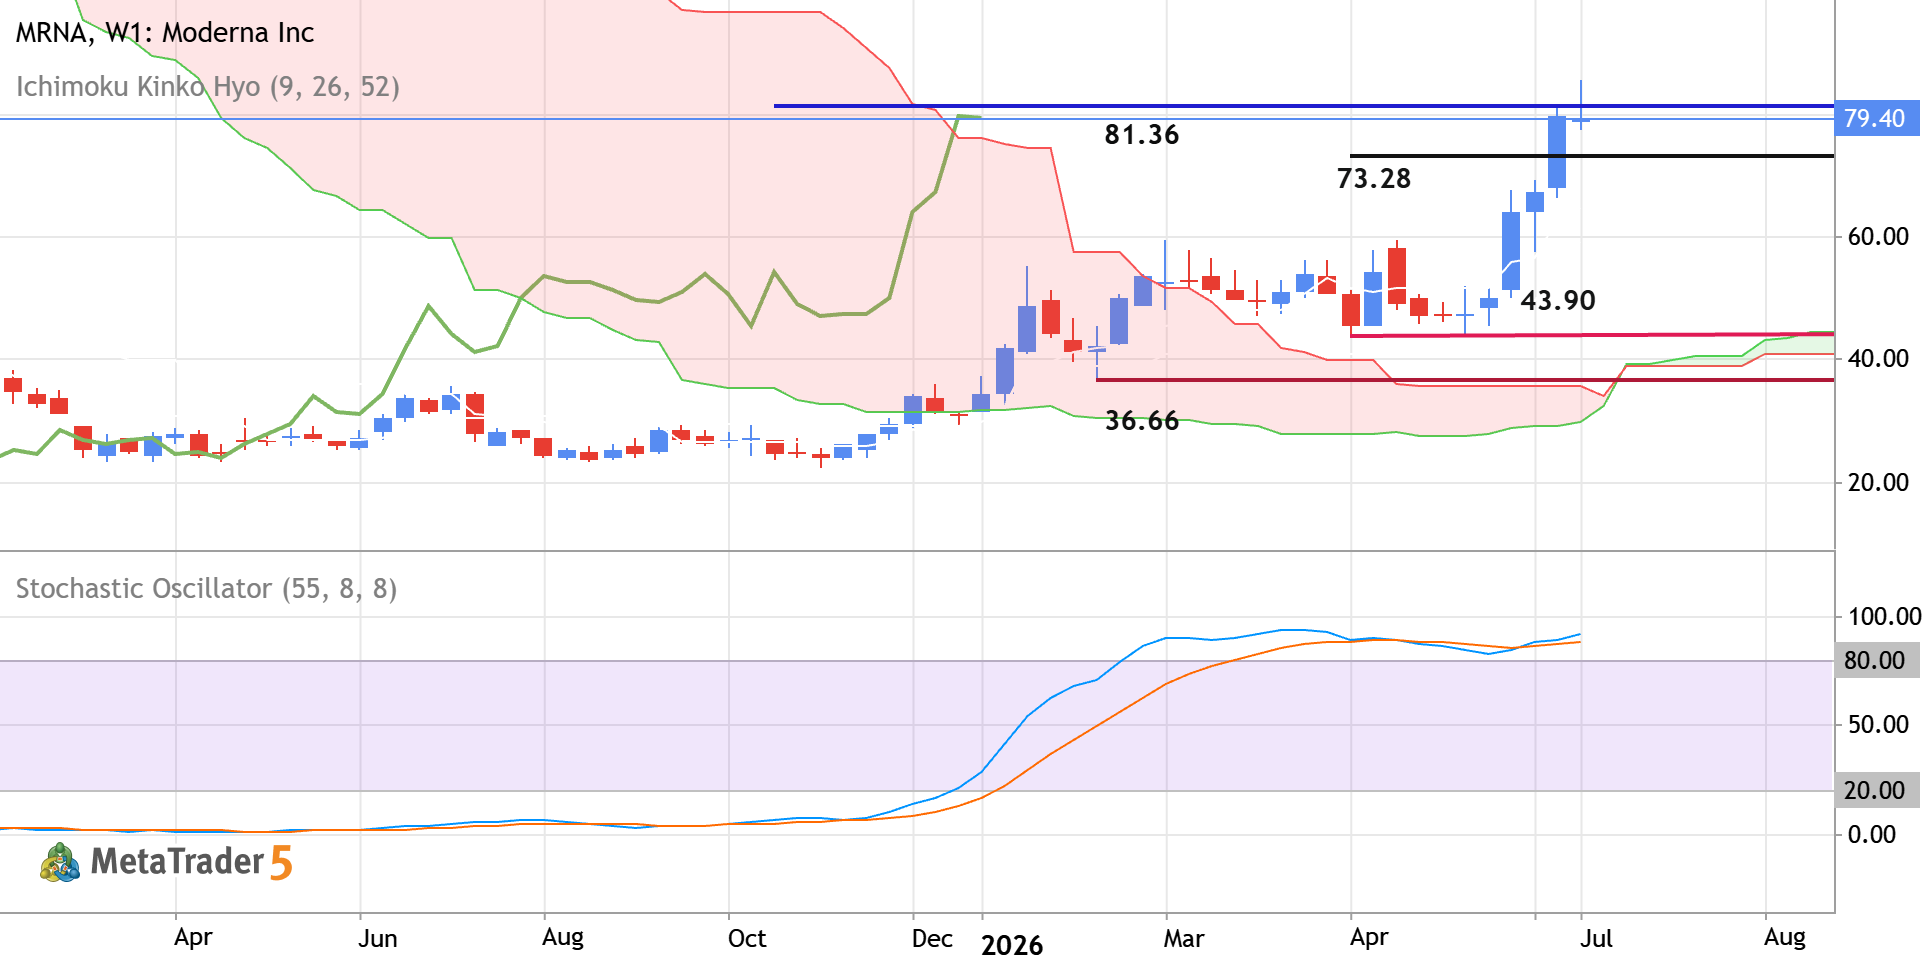
Weekly price is located above Ichimoku cloud in the bullish area of the chart for trying to cross the level at 81.36 to above for the strong bullish trend to be continuing. The price is on strong bullish breakout which is confirmed by Stochastic oscillator and Chinkou Span line. If the price breaks the 81.36 level to above on weekly close bar so the strong bullish trend will be continuing. If the price crosses the level at 73.28 to below so the secondary correction will be started. If the price breaks the support level at 43.90 to 36.66 to be crossed on weekly close bar so we may see the primary bearish reversal to be started on this W1 timeframe for example. Alternatively, the price will be on ranging to be near and above Ichimoku cloud waiting for direction. Trading Summary : bullish
0
newdigital Sergey Golubev 2026.07.07 17:40