BTCUSDT — Bullish Range Reclaim Forecast [Quantum Algo] BTCUSD Bitcoin vs US Dollar

BTCUSDT — Bullish Range Reclaim Forecast [Quantum Algo]

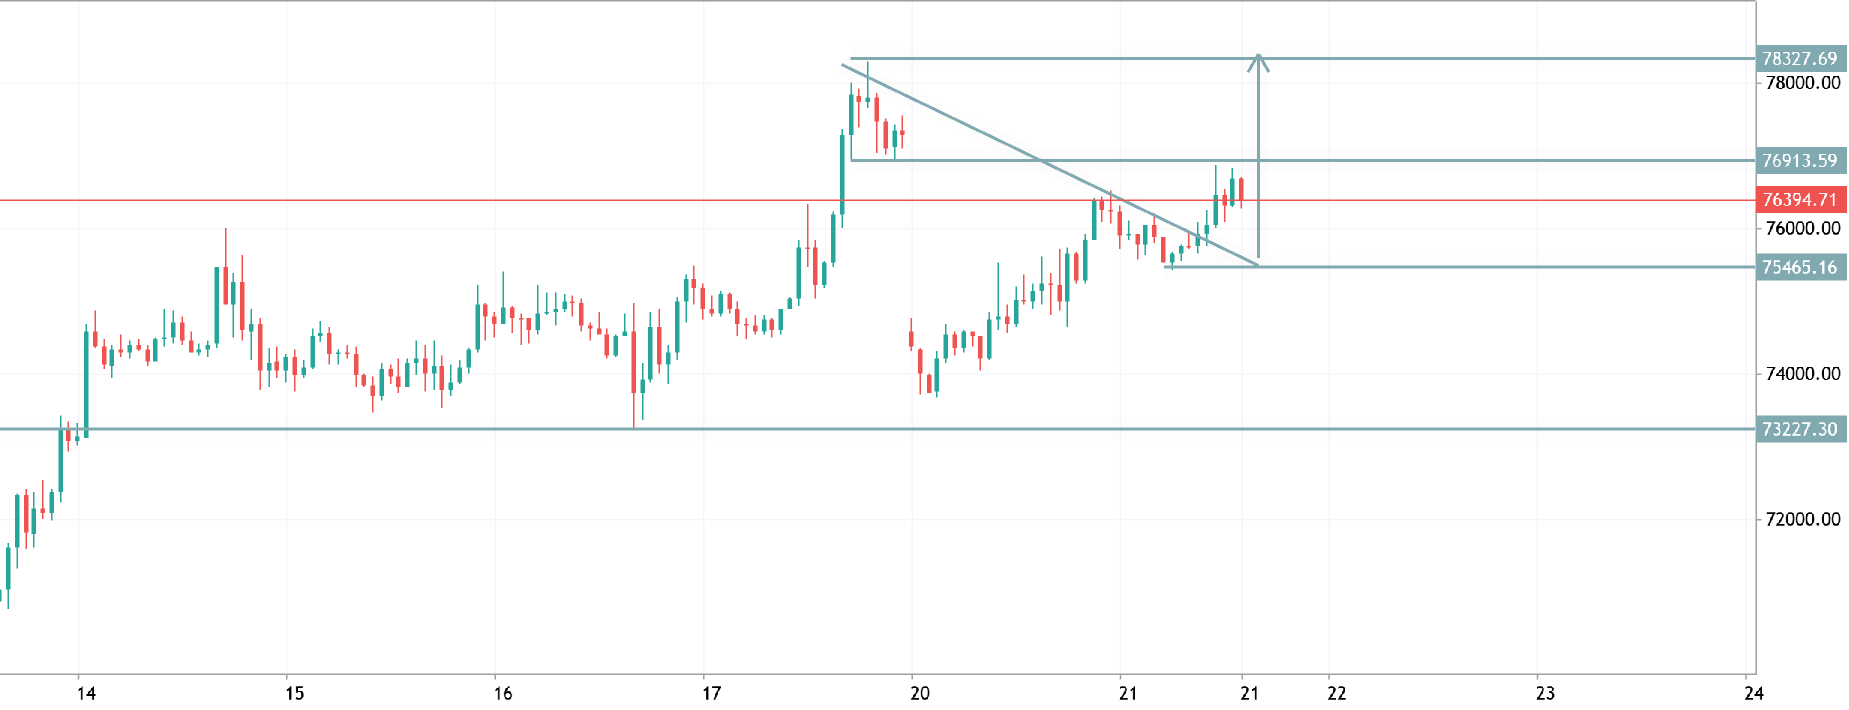
BTC has been rotating in a well-defined 59K–67K range for weeks. Twice now price has probed below the 59K floor, swept resting liquidity under the range, and snapped straight back inside — the textbook bear-trap signature. Each sweep failed to find continuation sellers, and price is now pushing back into the upper half of the range with momentum turning up. This is a forecast for a bullish continuation: reclaimed support, trapped shorts overhead as fuel, drawing toward the range highs. Why this setup works — three confluences: Double liquidity sweep and reclaim. Two clean stabs below the 59K floor, both rejected and recovered inside the range. When a level gets swept twice with no downside follow-through, it signals the sellers underneath have been absorbed — the stops are taken and the
XAUUSD — Short at Supply Rejection [Quantum Algo] XAUUSD Short Gold vs US Dollar

XAUUSD — Short at Supply Rejection [Quantum Algo]

Gold bounced off the 4,155 session low and rallied back up into an intraday supply pocket near 4,176 — the same area that capped the earlier swings around 4,179–4,180. Price pushed into the zone and stalled, firing the Sell. This is a scalp short off supply: fade the recovery into resistance, target the recent demand shelf where buyers last stepped in. Why this setup works — three confluences: Supply rejection at intraday resistance. The 4,176–4,180 band has repeatedly capped price through the session. The recovery ran straight back into it and stalled — the reaction printed on the tap, giving a tight, defined ceiling to lean risk against. Recovery into resistance, not breakout. The move off 4,155 is a corrective bounce back to the top of the intraday range, not a trend break. Selling into
XAUUSD — Short at Supply Rejection [Quantum Algo] XAUUSD Short Gold vs US Dollar

XAUUSD — Short at Supply Rejection [Quantum Algo]

Gold recovered off the 3,960 lows and rallied back into the same overhead supply band that capped price earlier in the range near 4,140. Price pushed into the zone and stalled, firing the Sell at 4,125. This is a return-to-supply short: the level already produced one sharp rejection off the 4,200 highs, and price has come back to test whether sellers still defend it. Why this setup works — three confluences: Proven supply zone. This isn't a fresh guess — the same overhead band rejected price hard earlier in the range, driving the drop toward 3,960. Price returning to a level that already produced a clean sell-off is testing tested resistance, and the reaction printed on the retest. Recovery into resistance, not breakout. The move off the lows is a mean-reversion bounce back to the top of
BNBUSDT — Short at Supply Rejection [Quantum Algo] BNBUSD Short Binance Coin (USD)

BNBUSDT — Short at Supply Rejection [Quantum Algo]

BNB rallied hard off the 536 lows, climbing through the 550 mid-range and pushing straight into an overhead supply block near 566. Price stalled at the top of the run and printed the Sell at 561.8. This is a mean-reversion short: the leg up ran into resistance without a pullback, and the play is to fade the exhaustion back toward the 550 shelf where prior structure sits. Why this setup works — three confluences: Supply rejection into resistance. The rally pushed into an overhead supply zone and stalled instead of breaking clean through. That's where sellers step in — the reaction printed on the tap, not on a guess, and it gives a defined ceiling to lean risk against. Extended move with no pullback. Price ran roughly 25 handles off the low in a near-vertical push. Moves this stretched
USDZAR — Short at Supply Rejection [Quantum Algo] USDZAR US Dollar vs Rand

USDZAR — Short at Supply Rejection [Quantum Algo]

Read the chart, Q — USDZAR 2h, forex. Sell fired at overhead supply around 16.45 after the range bounce failed. Levels eyeballed off the zone and the target box; swap in your exact marks if you've got them. Title: USDZAR — Short at Supply Rejection [Quantum Algo] Context: USDZAR has been rotating in a wide 16.15–16.66 range for weeks. Price rallied off the 16.35 lows, pushed back up into an overhead supply block near 16.45, and stalled. The rejection off that zone fired the Sell. This is a range short: fade the top of the balance, target the mid and the range low where liquidity rests. Why this setup works — three confluences: Supply rejection at range resistance. Price tapped the overhead supply block and failed to break through. This zone has capped rallies before, so it's a level with
XAUUSD (Gold) – M15 Chart Analysis Summary XAUUSD Gold vs US Dollar

XAUUSD (Gold) – M15 Chart Analysis Summary

From the chart, the market structure is still bullish overall , but the short-term momentum is weakening after a strong impulsive rally. Market Structure Gold made a strong bullish breakout , pushing price from around 3965 to above 4090 , confirming aggressive buying. After reaching the highs near 4105–4110 , price has entered a pullback/consolidation phase. The current candles show lower highs, indicating that buyers are taking profits and sellers are gaining some short-term control. Key Levels Resistance: 4088–4110 (highlighted supply zone) This is where sellers stepped in after the breakout. Current Price: Around 4065 Major Support: 3960–3970 (blue demand zone) This is the last strong accumulation area before the rally. It is also the area where buyers are most likely to defend the
btcusd h1 analysis BTCUSD Bitcoin vs US Dollar

btcusd h1 analysis

BTCUSD | H1 Analysis Price remains under bearish trendline resistance, keeping sellers in control. A rejection from the resistance zone suggests another move toward lower support if bulls fail to reclaim the trendline. Watch for a breakout above resistance before considering a bullish shift. Bias: Bearish 📉 Key Levels: Resistance: 59,300–59,500 | Support: 58,100–57,800 Trade Safe – Wait for Confirmation.
BTCUSD TRADE IDEA BTCUSD Long Bitcoin vs US Dollar

BTCUSD TRADE IDEA

BTCUSD (H1) Trade Analysis – Bullish Bias Market Structure Price is trading inside a descending wedge , a pattern that often precedes a bullish breakout. Buyers have defended the 58,000–58,800 support area several times. Short-term momentum remains weak until the wedge resistance is broken. Buy Setup Entry Zone: 58,500–59,000 (after bullish confirmation) Stop Loss: Below 57,950 Take Profit 1: 60,300–60,600 Take Profit 2: 61,800–62,100 Take Profit 3: 63,500–64,000 (if bullish momentum continues) Alternative Scenario If BTC closes below 57,950 , the bullish setup is invalidated. A breakdown could lead to a move toward 57,000 and potentially 56,000 . Trading Plan Wait for a strong bullish rejection from support or a break and close above the wedge resistance before entering. Avoid buying in
EURUSD TRADE IDEA EURUSD Long Euro vs US Dollar

EURUSD TRADE IDEA

EURUSD – H1 Trade Analysis Based on the chart, EURUSD is showing a bullish bias after respecting an ascending trendline and holding above key support. Market Structure Trend: Short-term bullish. Price has formed higher lows , supported by the rising trendline. Buyers defended the 1.1403–1.1405 support zone multiple times. Key Levels Support: 1.1403 Immediate Resistance: 1.1410 Major Resistance / Target: 1.1432 Trade Idea (Buy) Entry: 1.1404–1.1410 (after a bullish rejection or candle close above resistance) Stop Loss: Below 1.1398 (or below the ascending trendline) Take Profit 1: 1.1423 Take Profit 2: 1.1432 Invalidation If price closes below 1.1403 and breaks the ascending trendline with strong bearish momentum, the bullish setup is invalidated and a move toward 1.1382 becomes more
XAUUSD TRADE IDEA XAUUSD Short Gold vs US Dollar

XAUUSD TRADE IDEA

XAUUSD (Gold) – M30 Trade Analysis From the chart, the market structure is bearish . Bearish Bias Price has formed lower highs and lower lows , confirming a short-term downtrend. The 3971.35 level (red line) has been broken and is acting as resistance. Sellers remain in control while price stays below 3983.72 . Key Levels Resistance: 3971.35 → 3983.72 Major Resistance: 4021.83 Support: 3960.80 Next Support: 3944.32 Trade Idea Sell Entry: Conservative: Wait for a pullback to 3971–3983 and look for bearish rejection. Aggressive: Sell on a confirmed break below 3960.80 . Targets: TP1: 3960.80 TP2: 3944.32 Stop Loss: Above 3983.72 , or above the most recent swing high. Outlook Momentum currently favors the downside. Unless buyers reclaim 3983.72 , the probability remains higher for a
XAUUSD M15 Analysis. XAUUSD Gold vs US Dollar

XAUUSD M15 Analysis.

Gold is currently holding above a key demand zone around 4015–4023 , where buyers have repeatedly defended price. The recent rejection from this area suggests bullish momentum remains intact as long as support continues to hold. Price is now consolidating just below the 4030 resistance. A successful breakout and close above this level could trigger the next leg higher toward 4065 , with an extended target near 4075–4078 , matching the previous swing high. Bullish Scenario Entry: Buy on a pullback into 4018–4023 or after a confirmed breakout above 4030 . Targets: TP1: 4048–4055 TP2: 4065 TP3: 4075–4078 Invalidation: A 15-minute candle closing below 4015 would weaken the bullish outlook and increase the risk of a move toward 4005 or lower. Key Levels Support: 4015–4023 (Demand Zone)