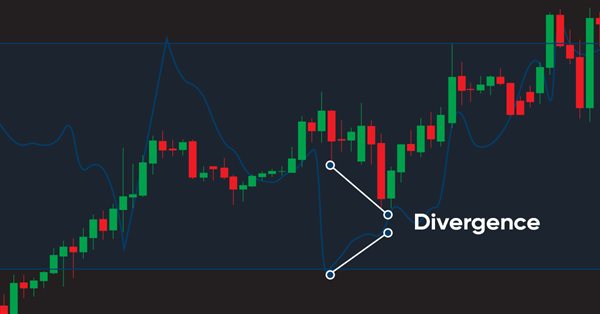
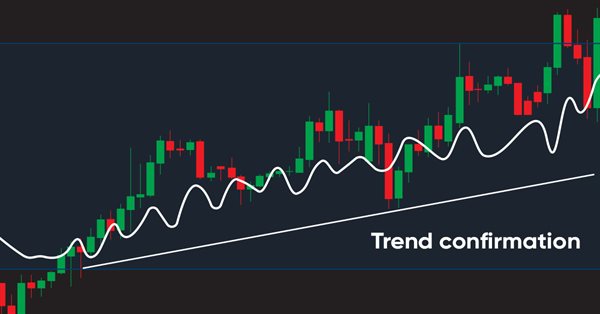
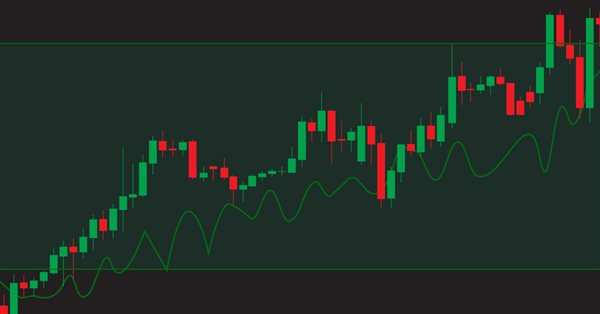
The new article from our series about designing a trading system based on the most popular technical indicators considers a new technical indicator - the Money Flow Index (MFI). We will learn it in detail and develop a simple trading system by means of MQL5 to execute it in MetaTrader 5.
In this article I am going to attempt to use our logistic model to predict the stock market crash based upon the fundamentals of the US economy, the NETFLIX and APPLE are the stocks we are going to focus on, Using the previous market crashes of 2019 and 2020 let's see how our model will perform in the current dooms and glooms.
Welcome to the new article from our series about learning how to design trading systems based on the most popular technical indicators. In this article, we will learn about a new technical indicator called Accumulation/Distribution indicator and find out how to design an MQL5 trading system based on simple AD trading strategies.
In this little video course you will learn how to download, install and setup MetaTrader 5 for Automated Trading. You will also learn how to adjust the chart settings and the options for automated trading. You will do your first backtest and by the end of this course you will know how to import an Expert Advisor that can automatically trade 24/7 while you don't have to sit in front of your screen.
This article starts an extensive topic of creating controls in Windows Forms style using MQL5. My first object of interest is creating the panel class. It is already becoming difficult to manage things without controls. Therefore, I will create all possible controls in Windows Forms style.
This is one of the most powerful indicators currently existing. Anyone who trades trying to have a certain degree of confidence must have this indicator on their chart. Most often the indicator is used by those who prefer “tape reading” while trading. Also, this indicator can be utilized by those who use only Price Action while trading.
This is a new article to continue our series for beginners about how to design a trading system based on some of the popular indicators. We will learn a new indicator that is On Balance Volume (OBV), and we will learn how we can use it and design a trading system based on it.
The majority of students in my courses felt that MQL5 was really difficult to understand. In addition to this, they were searching for a straightforward method to automate a few processes. Find out how to begin working with MQL5 right now by reading the information contained in this article. Even if you have never done any form of programming before. And even in the event that you are unable to comprehend the previous illustrations that you have observed.
In the current article, I will eliminate obvious flaws in simultaneous handling of extended (and standard) graphical objects and form objects on canvas, as well as fix errors detected during the test performed in the previous article. The article concludes this section of the library description.
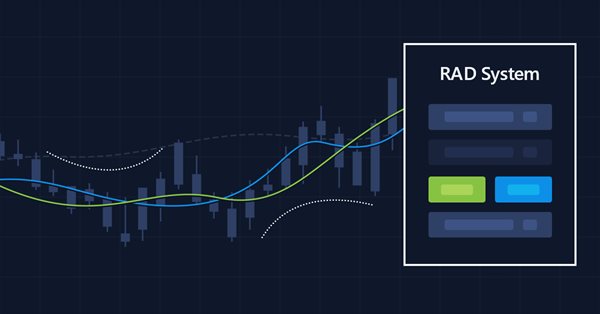
In my previous article, I showed you how to create a Chart Trade using MetaTrader 5 objects and thus to turn the platform into a RAD system. The system works very well, and for sure many of the readers might have thought about creating a library, which would allow having extended functionality in the proposed system. Based on this, it would be possible to develop a more intuitive Expert Advisor with a nicer and easier to use interface.
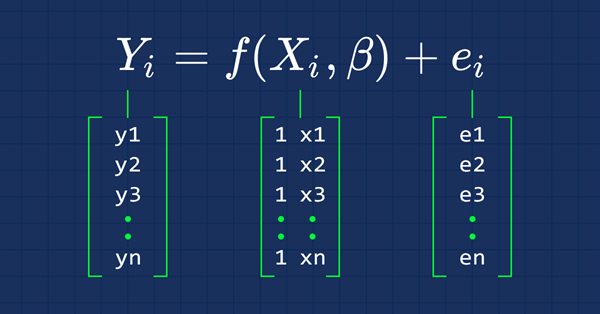
This time our models are being made by matrices, which allows flexibility while it allows us to make powerful models that can handle not only five independent variables but also many variables as long as we stay within the calculations limits of a computer, this article is going to be an interesting read, that's for sure.
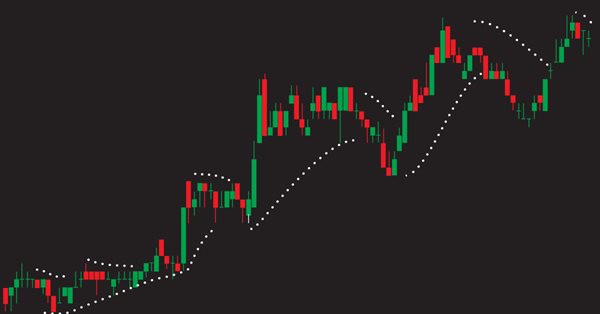
In this article, we will continue our series about how to design a trading system using the most popular indicators. In this article, we will learn about the Parabolic SAR indicator in detail and how we can design a trading system to be used in MetaTrader 5 using some simple strategies.
There are a lot of people who do not know how to program but they are quite creative and have great ideas. However, the lack of programming knowledge prevents them from implementing these ideas. Let's see together how to create a Chart Trade using the MetaTrader 5 platform itself, as if it were an IDE.
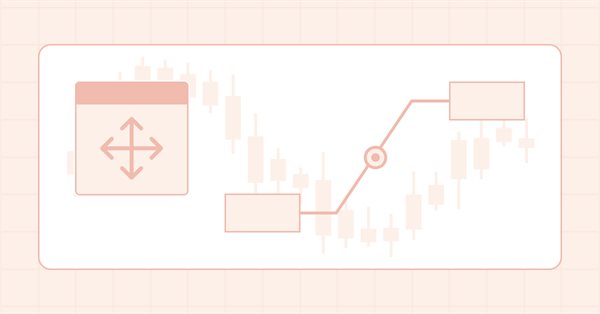
In the previous article, I implemented the ability to move pivot points of an extended graphical object using control forms. Now I am going to implement the ability to move a composite graphical object using a single graphical object control point (form).
In my previous articles, I have explained how to create an indicator with multiple subwindows, which becomes interesting when using custom indicators. This time we will see how to add multiple windows to an Expert Advisor.
In the article, I continue the development of extended standard graphical objects and create the functionality for moving pivot points of composite graphical objects using the control points for managing the coordinates of the graphical object pivot points.
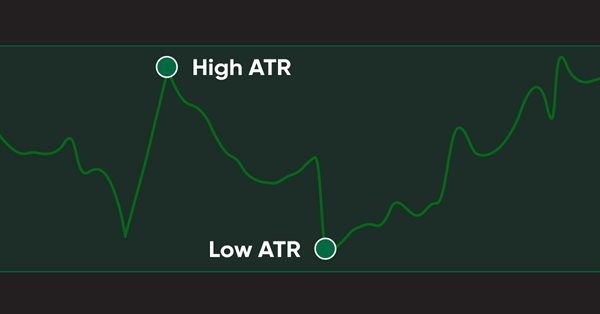
In this article, we will learn a new technical tool that can be used in trading, as a continuation within the series in which we learn how to design simple trading systems. This time we will work with another popular technical indicator: Average True Range (ATR).
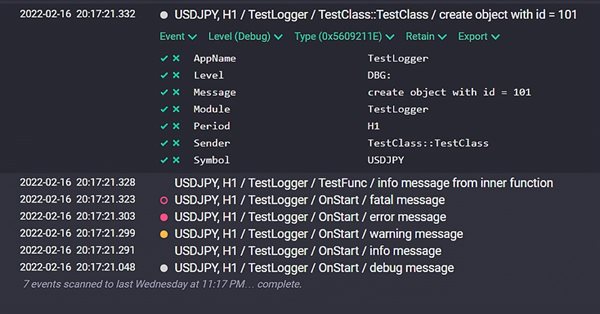
Implementation of the Logger class for unifying and structuring messages which are printed to the Experts log. Connection to the Seq log collection and analysis system. Monitoring log messages online.
Today we will update the functionality of the indicator system for the first time. In the previous article within the "Multiple indicators on one chart" we considered the basic code which allows using more than one indicator in a chart subwindow. But what was presented was just the starting base of a much larger system.
In the previous article "Multiple indicators on one chart" I presented the concept and the basics of how to use multiple indicators on one chart. In this article, I will provide the source code and will explain it in detail.
In this article, we will continue our series about designing a trading system using the most popular indicators and we will talk about the average directional index (ADX) indicator. We will learn this indicator in detail to understand it well and we will learn how we to use it through a simple strategy. By learning something deeply we can get more insights and we can use it better.
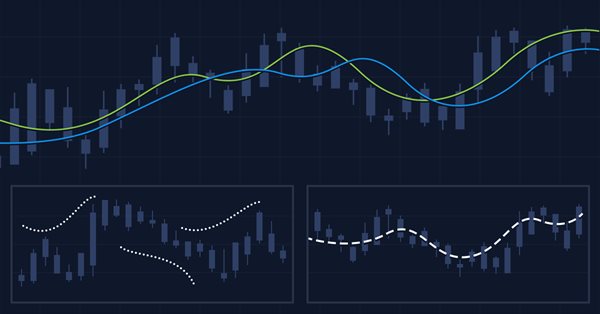
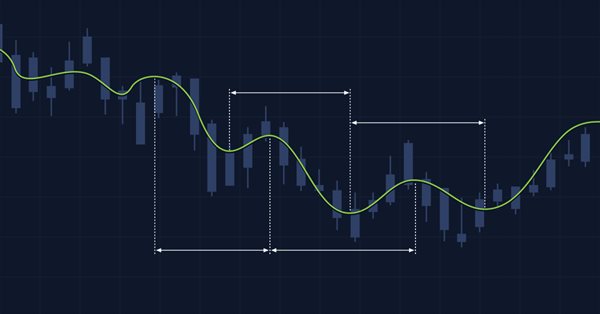
The article considers several methods of applying the Moving Average indicator. Each method involving a curve analysis is accompanied by indicators visualizing the idea. In most cases, the ideas shown here belong to their respected authors. My sole task was to bring them together to let you see the main approaches and, hopefully, make more reasonable trading decisions. MQL5 proficiency level — basic.
Many workstations contain some representative image which shows something about the user. These images make the working environment more beautiful and exciting. Let's see how to make the charts more interesting by adding a background.
In this article, I will consider the implementation of the independent dragging of any form objects using a mouse. Besides, I will complement the library by error messages and new deal properties previously implemented into the terminal and MQL5.
It is an introductory article on DirectX, which describes specifics of operation with the API. It should help to understand the order in which its components are initialized. The article contains an example of how to write an MQL5 script which renders a triangle using DirectX.
In this article, we continue our learning series — this time we will learn how to design a trading system using one of the most popular and useful indicators, which is the Stochastic Oscillator indicator, to build a new block in our knowledge of basics.
The article considers the use of the CCanvas class in MQL applications. The theory is accompanied by detailed explanations and examples for thorough understanding of CCanvas basics.
In this article, we will learn a new tool from our series: we will learn how to design a trading system based on one of the most popular technical indicators Moving Average Convergence Divergence (MACD).
Today we will learn how to add multiple indicators running simultaneously on one chart, but without occupying a separate area on it. Many traders feel more confident if they monitor multiple indicators at a time (for example, RSI, STOCASTIC, MACD, ADX and some others), or in some cases even at different assets which an index is made of.
Data Classification is a crucial thing for an algo trader and a programmer. In this article, we are going to focus on one of classification logistic algorithms that can probability help us identify the Yes's or No's, the Ups and Downs, Buys and Sells.
In this new article from our series for learning how to design trading systems, I will present the Commodities Channel Index (CCI), explain its specifics, and share with you how to create a trading system based on this indicator.
Return on investments is the most obvious indicator which investors and novice traders use for the analysis of trading efficiency. Professional traders use more reliable tools to analyze strategies, such as Sharpe and Sortino ratios, among others.
In this article, I will start creating the functionality for handling mouse events in form objects, as well as add new properties and their tracking to a symbol object. Besides, I will improve the symbol object class since the chart symbols now have new properties to be considered and tracked.
This article is a continuation and completion of the topic discussed in the previous article: the MVC pattern in MQL programs. In this article, we will consider a diagram of possible interaction between the three components of the pattern.
In my previous article, I mentioned the importance of identifying the trend which is the direction of prices. In this article I will share one of the most important concepts and indicators which is the Momentum indicator. I will share how to design a trading system based on this Momentum indicator.
In this article, I will consider the toolkit for managing composite graphical objects - controls for managing an extended standard graphical object. Today, I will slightly digress from relocating a composite graphical object and implement the handler of change events on a chart featuring a composite graphical object. Besides, I will focus on the controls for managing a composite graphical object.
It's time for us as traders to train our systems and ourselves to make decisions based on what number says. Not on our eyes, and what our guts make us believe, this is where the world is heading so, let us move perpendicular to the direction of the wave.
In this article, I will start the development of various composite graphical object events. We will also partially consider moving and deleting a composite graphical object. In fact, here I am going to fine-tune the things I implemented in the previous article.
In this article, we will consider some of the essential points you should pay attention to when purchasing an Expert Advisor. We will also look for ways to increase profit, to spend money wisely, and to earn from this spending. Also, after reading the article, you will see that it is possible to earn even using simple and free products.
In this article, I will share with you one of the most popular and commonly used indicators in the world of trading which is RSI. You will learn how to design a trading system using this indicator.