XAUUSD H4 ANALYSIS XAUUSD Gold vs US Dollar
XAUUSD H4 ANALYSIS
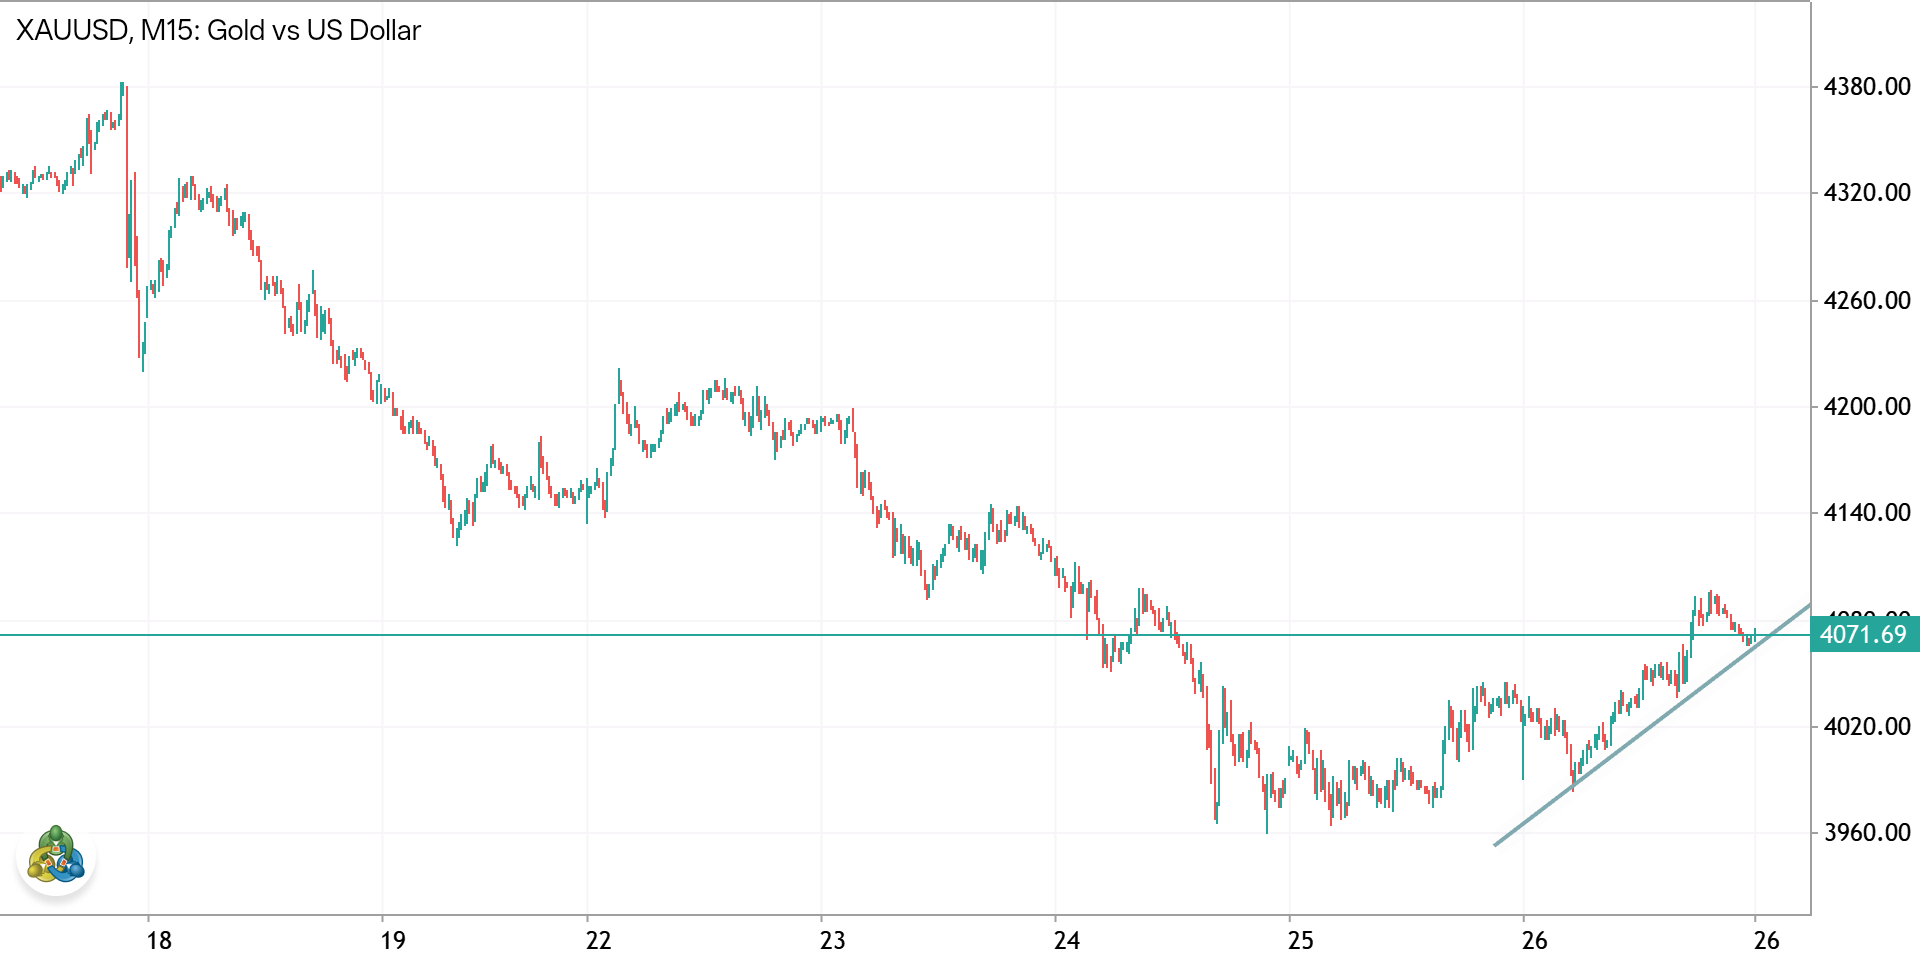
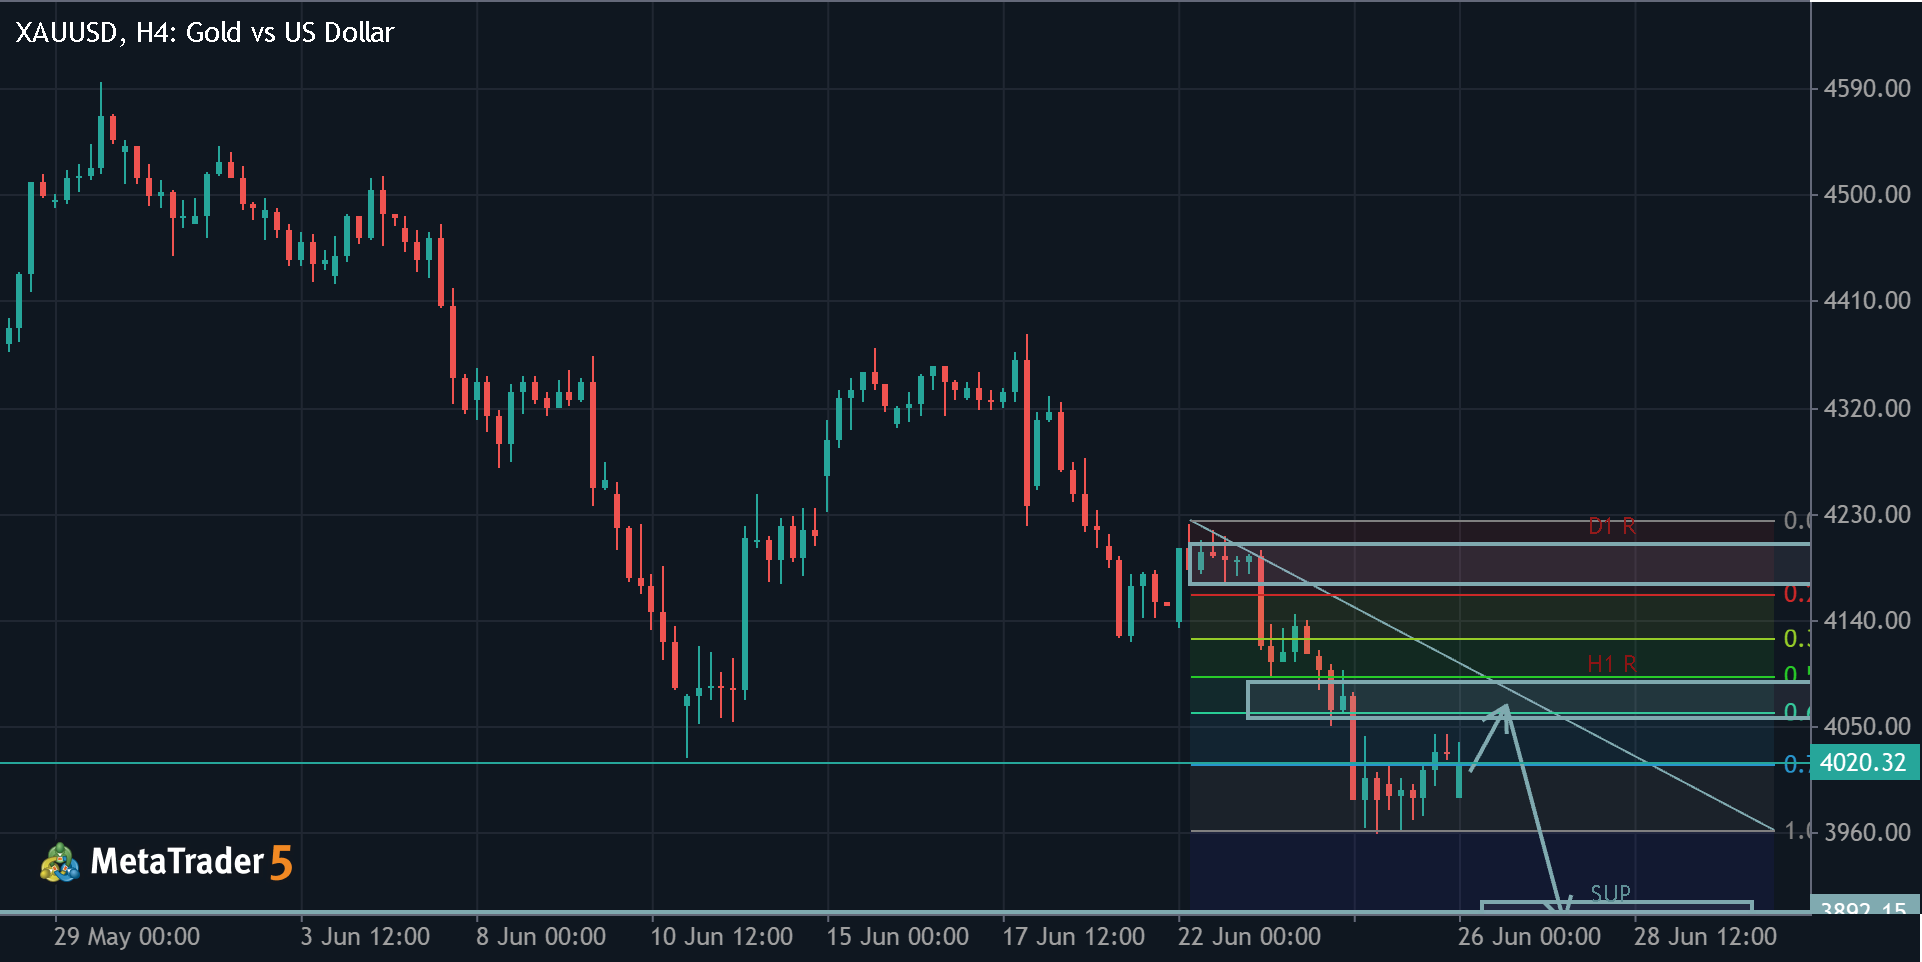
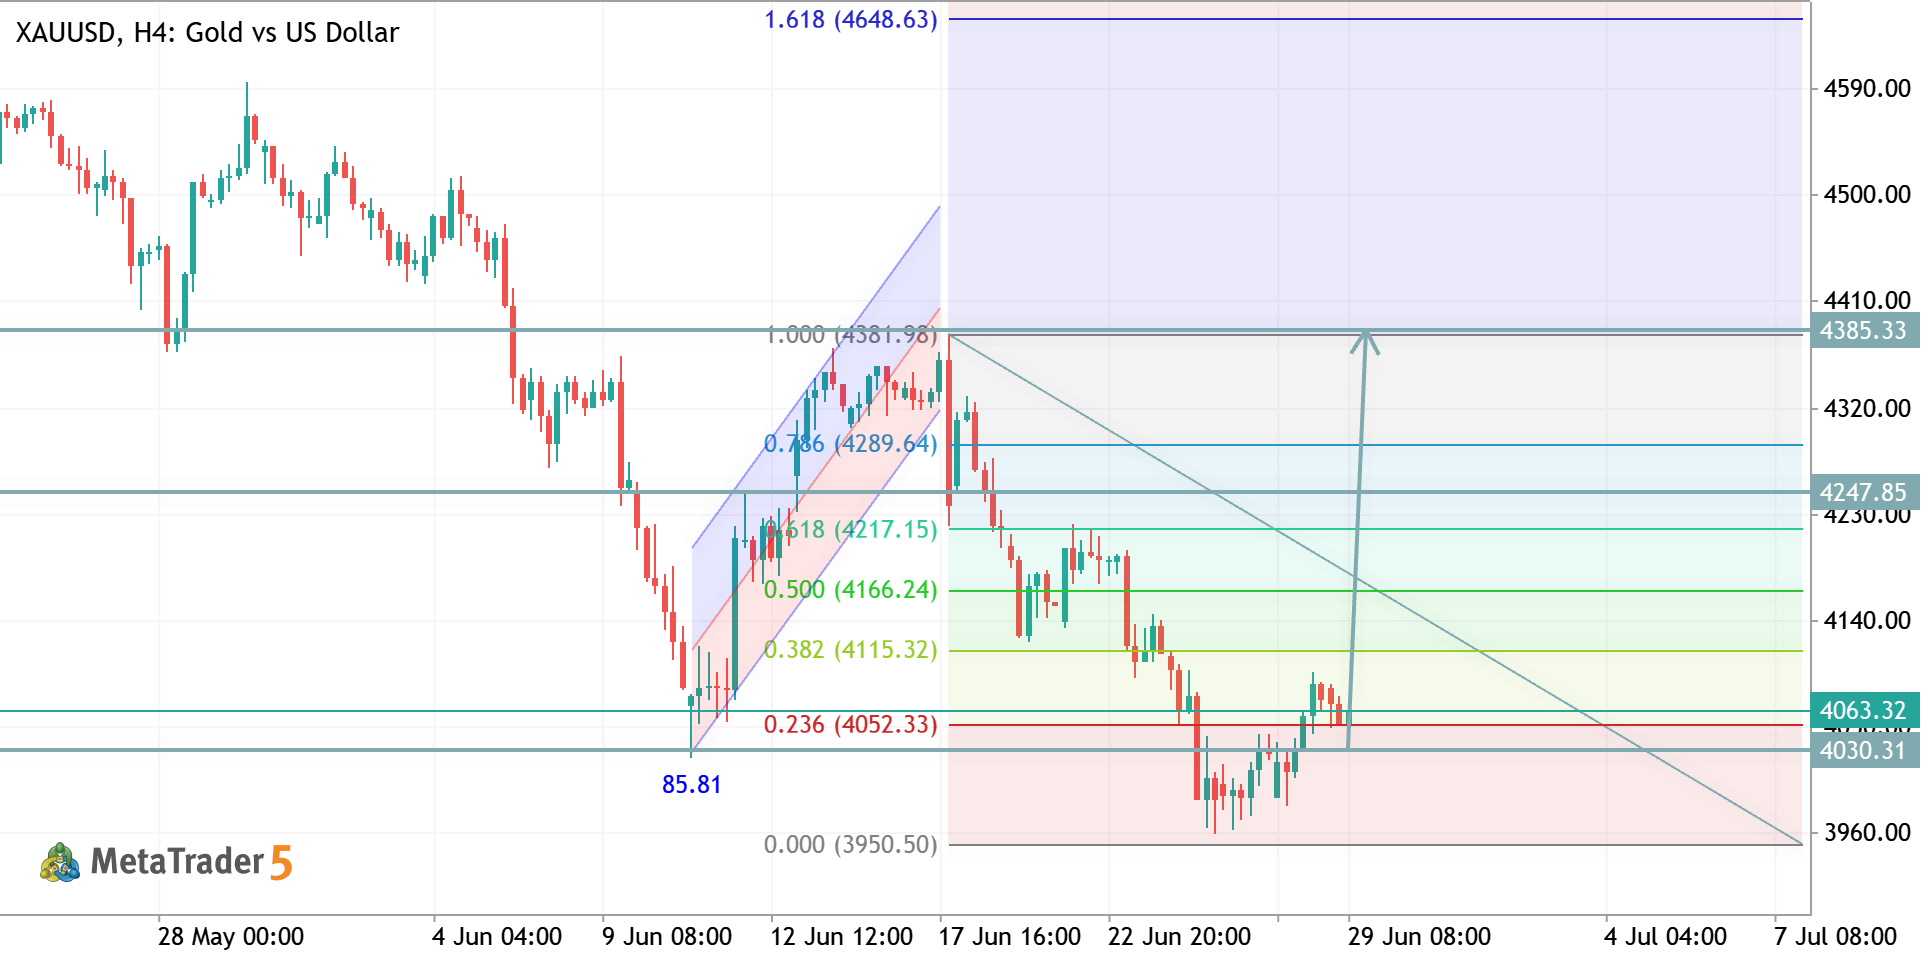
XAUUSD H4 Analysis Gold is attempting a recovery after respecting the 0.236 Fibonacci support. Buyers are stepping in, but price still needs to break the nearby resistance to confirm a stronger bullish move. 📈 Bullish Scenario: A sustained breakout above 4285–4385 could open the path toward 4648. 📉 Bearish Scenario: If price gets rejected at resistance, expect a retest of the 4050 support area. Bias: Bullish above support, but confirmation above resistance is essential before expecting further upside. #XAUUSD #Gold #Forex #TechnicalAnalysis #MQL5 #PriceAction
0

Goldanalysisteam Abdul Qayoom 2026.06.29 08:09
XAUUSD – Falling Wedge Breakout Setup | H1 🪙 XAUUSD Long Gold vs US Dollar
XAUUSD – Falling Wedge Breakout Setup | H1 🪙
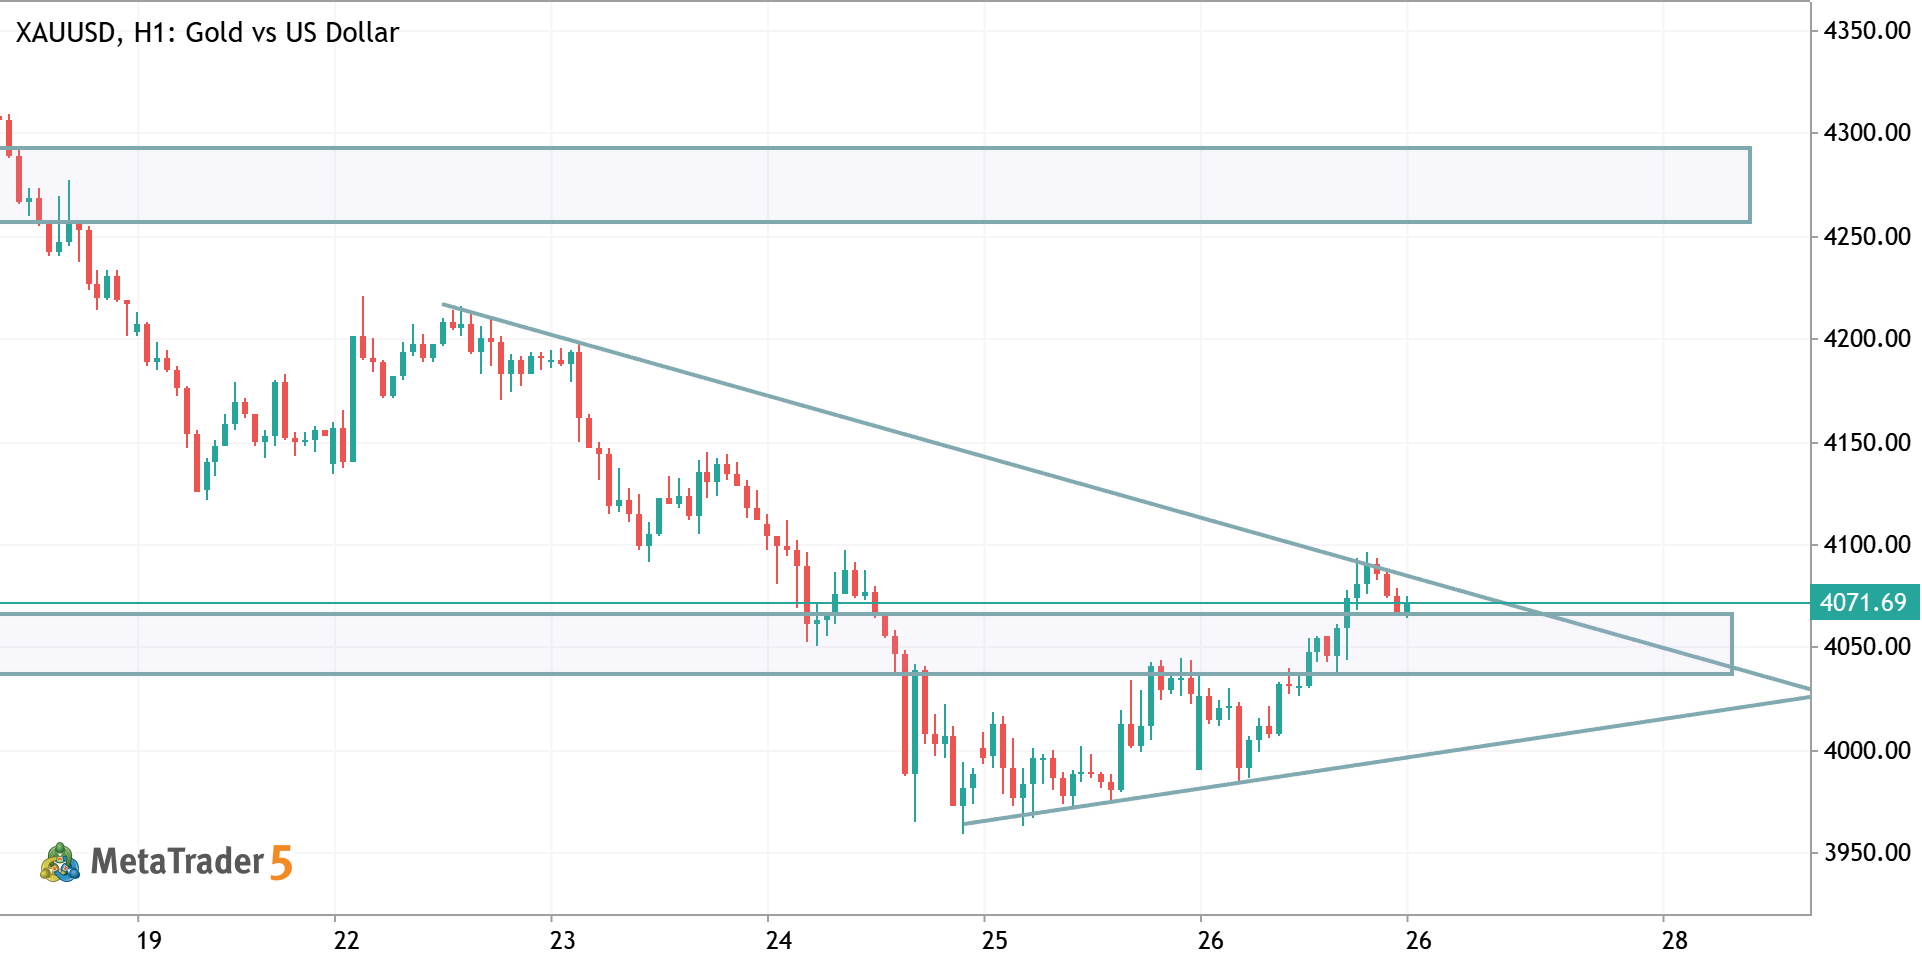
XAUUSD – Falling Wedge Breakout Setup | H1 🪙 Gold printed a clean sweep of lows at 3,948–3,970 after the aggressive breakdown from 4,371 , and has since been building a falling wedge structure off that bottom — a classic compression before expansion. Price is now pushing into the 4,033–4,072 support zone while simultaneously testing the wedge's upper trendline. Two confluences meeting at the same level is not something you ignore. Key Levels: 🟦 Resistance Zone: 4,265 – 4,286 🟩 Support Zone: 4,033 – 4,072 ← price testing now 📍 Current Price: 4,071 Bias: Bullish reversal — wedge breakout + support hold Target: 4,265 – 4,286 resistance zone Invalidation: H1 close below 3,960 The structure and levels were plotted automatically by Breakout Pattern Setup [Aurex] — an indicator I built that
0
forexfalcon02 Imoro Abdul-rahaman 2026.06.28 16:30
USDIND - Daily Ranging for Direction USDINR US Dollar vs Indian Rupee
USDIND - Daily Ranging for Direction
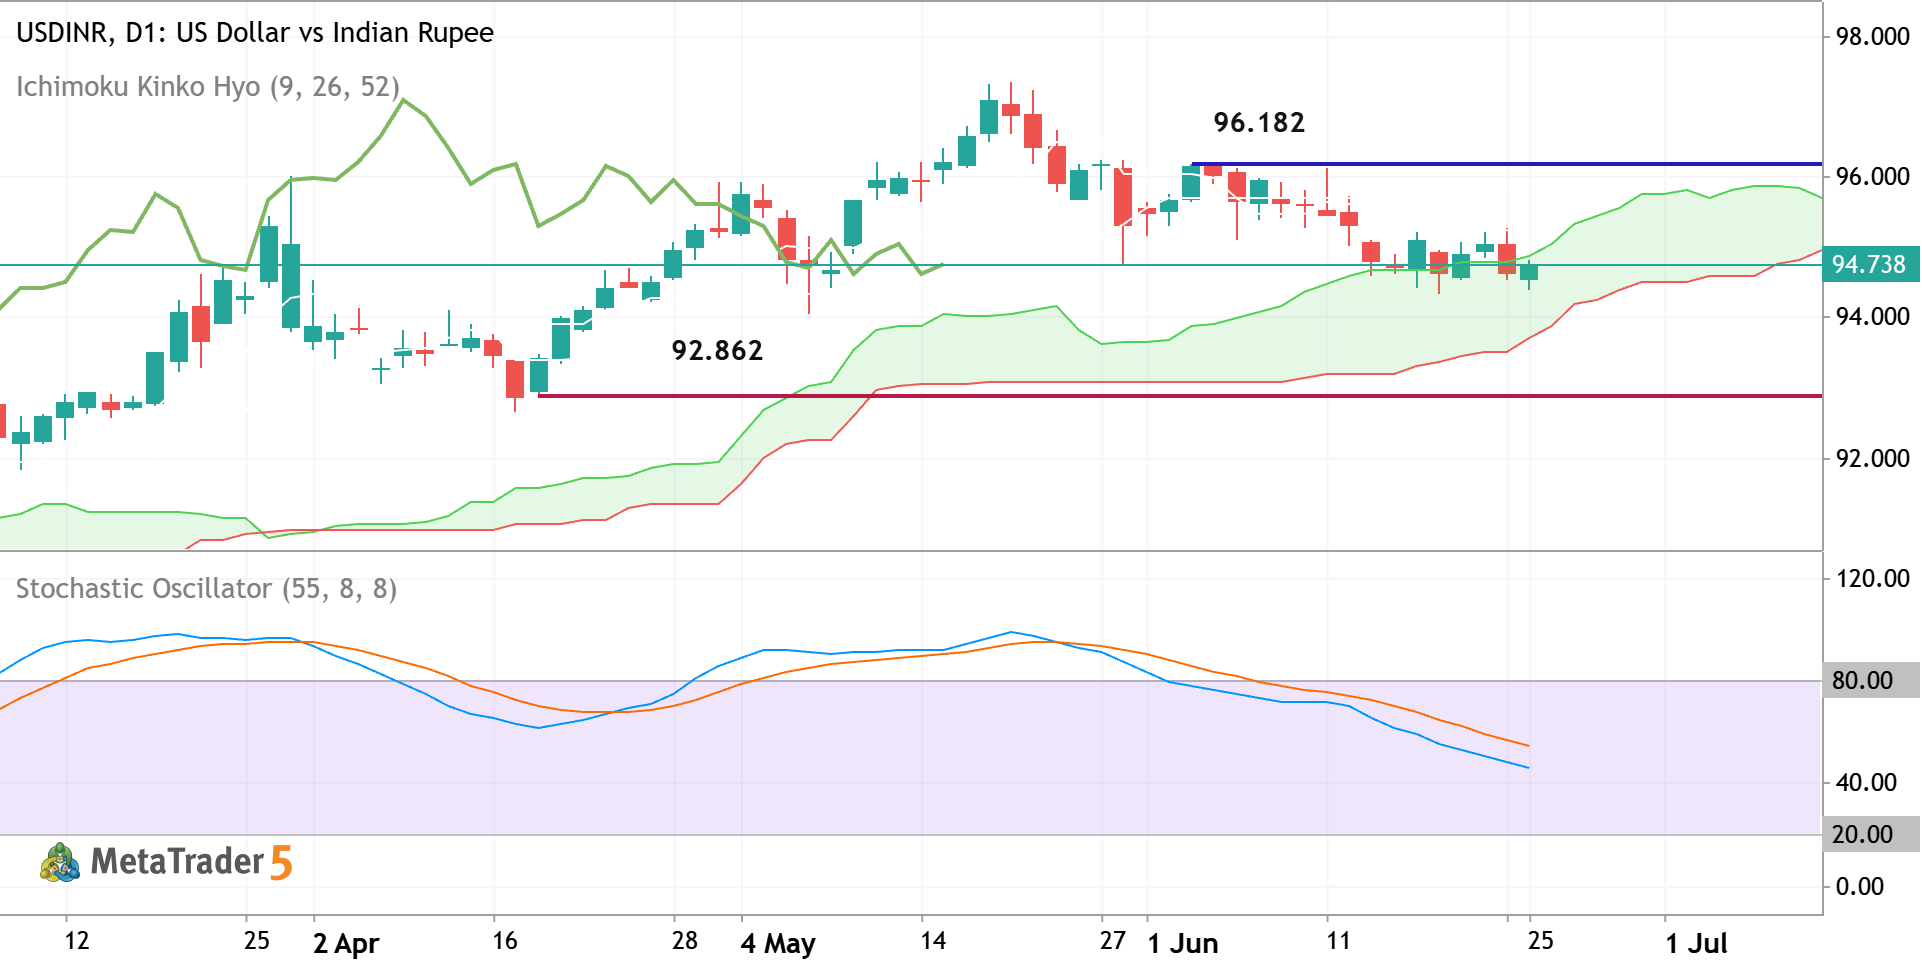
Daily price broke the upper border of Ichimoku cloud to below for the secondary ranging market condition. Chinkou Span line of Ichimoku indicator crossed the historycal price to below as well for the good daily breakdown to be started. Stochastic oscillator is showing the bearish condition to be continuing for example. If the price breaks support level at 92.862 to below so the primary bearish reversal will be started. If the price crosses the resistance level at 96.182 to above so the primary bullish trend will be resumed. Alternatively, the price will be on secondary ranging to be near and inside Ichimoku cloud waiting for direction. Recommendation : Waiting for Direction.
3
newdigital Sergey Golubev 2026.06.28 15:00
XAUUSD TRADE IDEA XAUUSD Long Gold vs US Dollar
XAUUSD TRADE IDEA
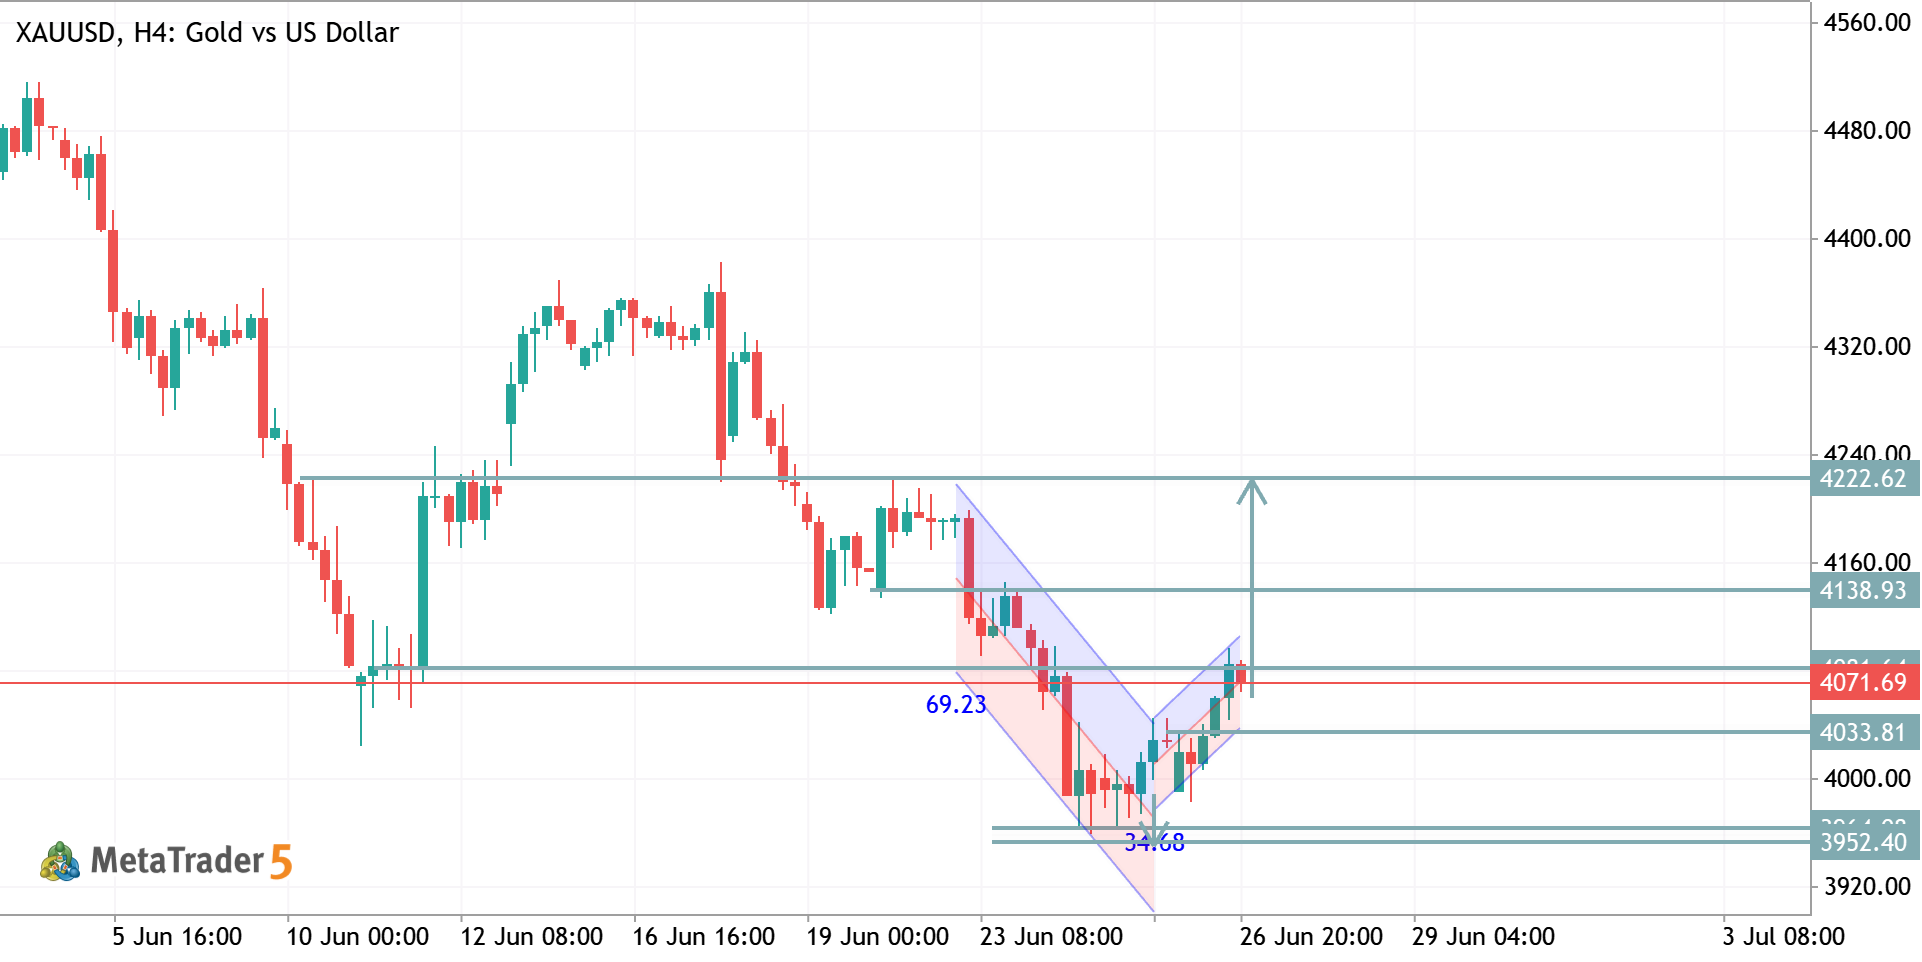
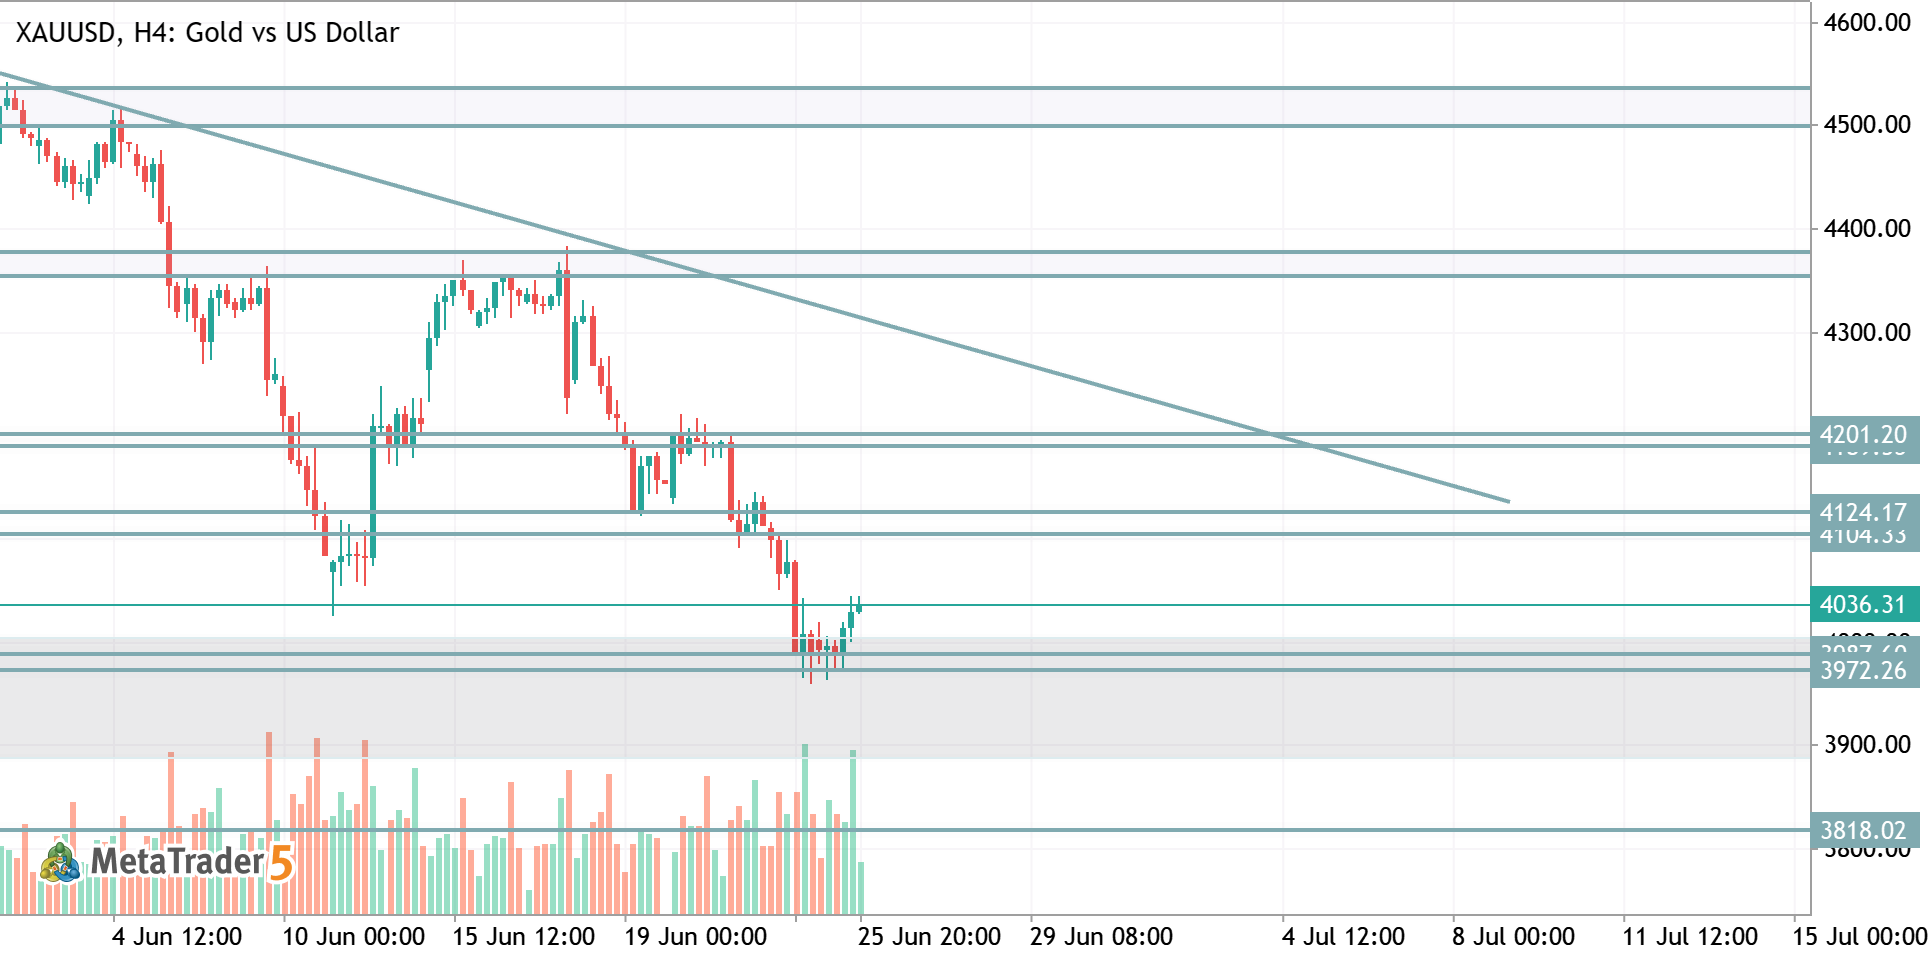
XAUUSD (Gold) H4 Trade Analysis – Buy Bias Market Structure: Bullish recovery after a completed falling channel breakout. Trend: Short-term bullish after breaking above the descending channel. Key Support: 4033–4072 Major Resistance: 4139 , then 4223 Momentum: Buyers have regained control, but price is testing resistance near 4072 . Buy Setup Entry: 4055–4075 (on a pullback or bullish confirmation) Stop Loss: Below 4025 Take Profit 1: 4139 Take Profit 2: 4223 Alternative Scenario If price closes below 4033 , the bullish setup weakens and gold could retest 3952 before finding new demand. Overall Bias: BUY while price remains above 4033 , targeting 4139 and 4223 .
1
HamadJatoi Hamad Jatoi 2026.06.28 12:48
XAUUSD TRADE IDEA XAUUSD Gold vs US Dollar
XAUUSD TRADE IDEA
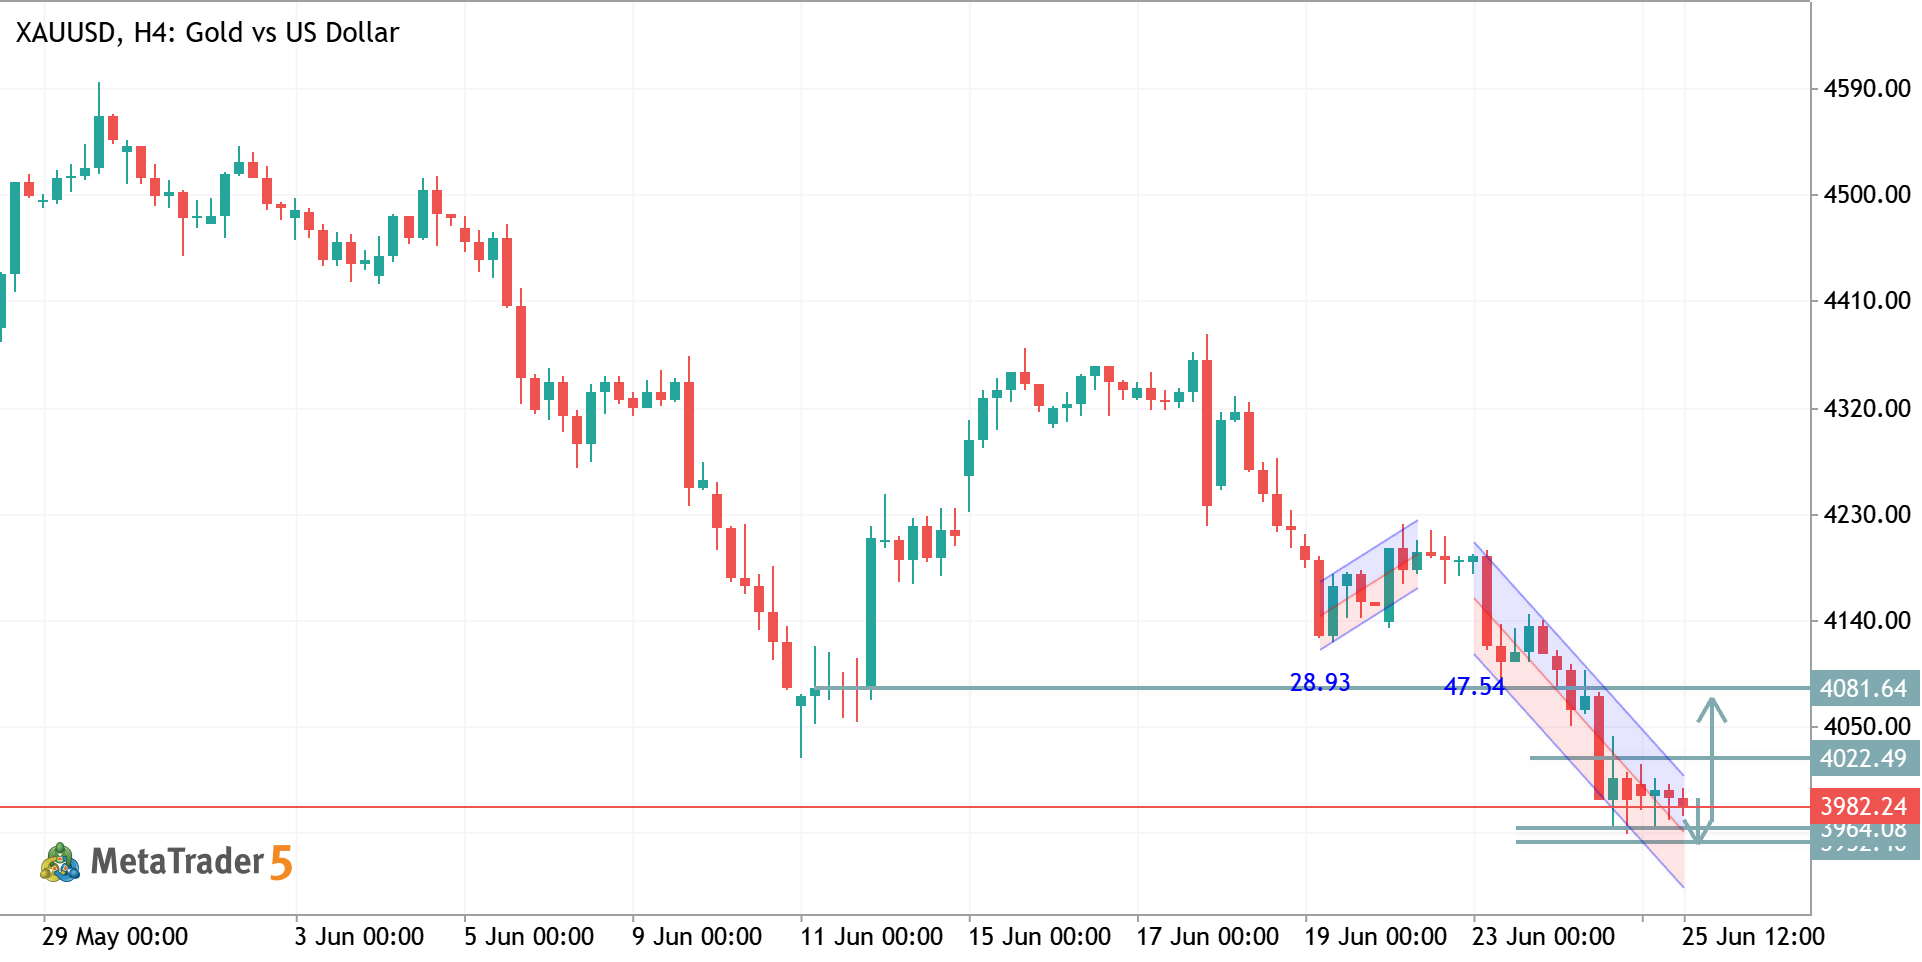
XAUUSD H4 – Bias: 🔴 Bearish Reasoning Price remains inside a descending channel. Lower highs and lower lows confirm the downtrend. Resistance at 4022–4081 has not been reclaimed. Sellers continue to control momentum. SHORT Entry Zones Aggressive: 3980–4000 Conservative: 4020–4080 (retest of resistance) Stop Loss Above 4090 Take Profit Targets 3960 3940 3920 3890 (extended target) Invalidation H4 candle closes above 4081 , weakening the bearish structure. Verdict ✅ SHORT favored while price remains below 4022–4081 . 🎯 Target support zone: 3940–3920 . 🛑 Stop above 409
0
HamadJatoi Hamad Jatoi 2026.06.25 12:08
xauusd h4 analysis XAUUSD Gold vs US Dollar
xauusd h4 analysis
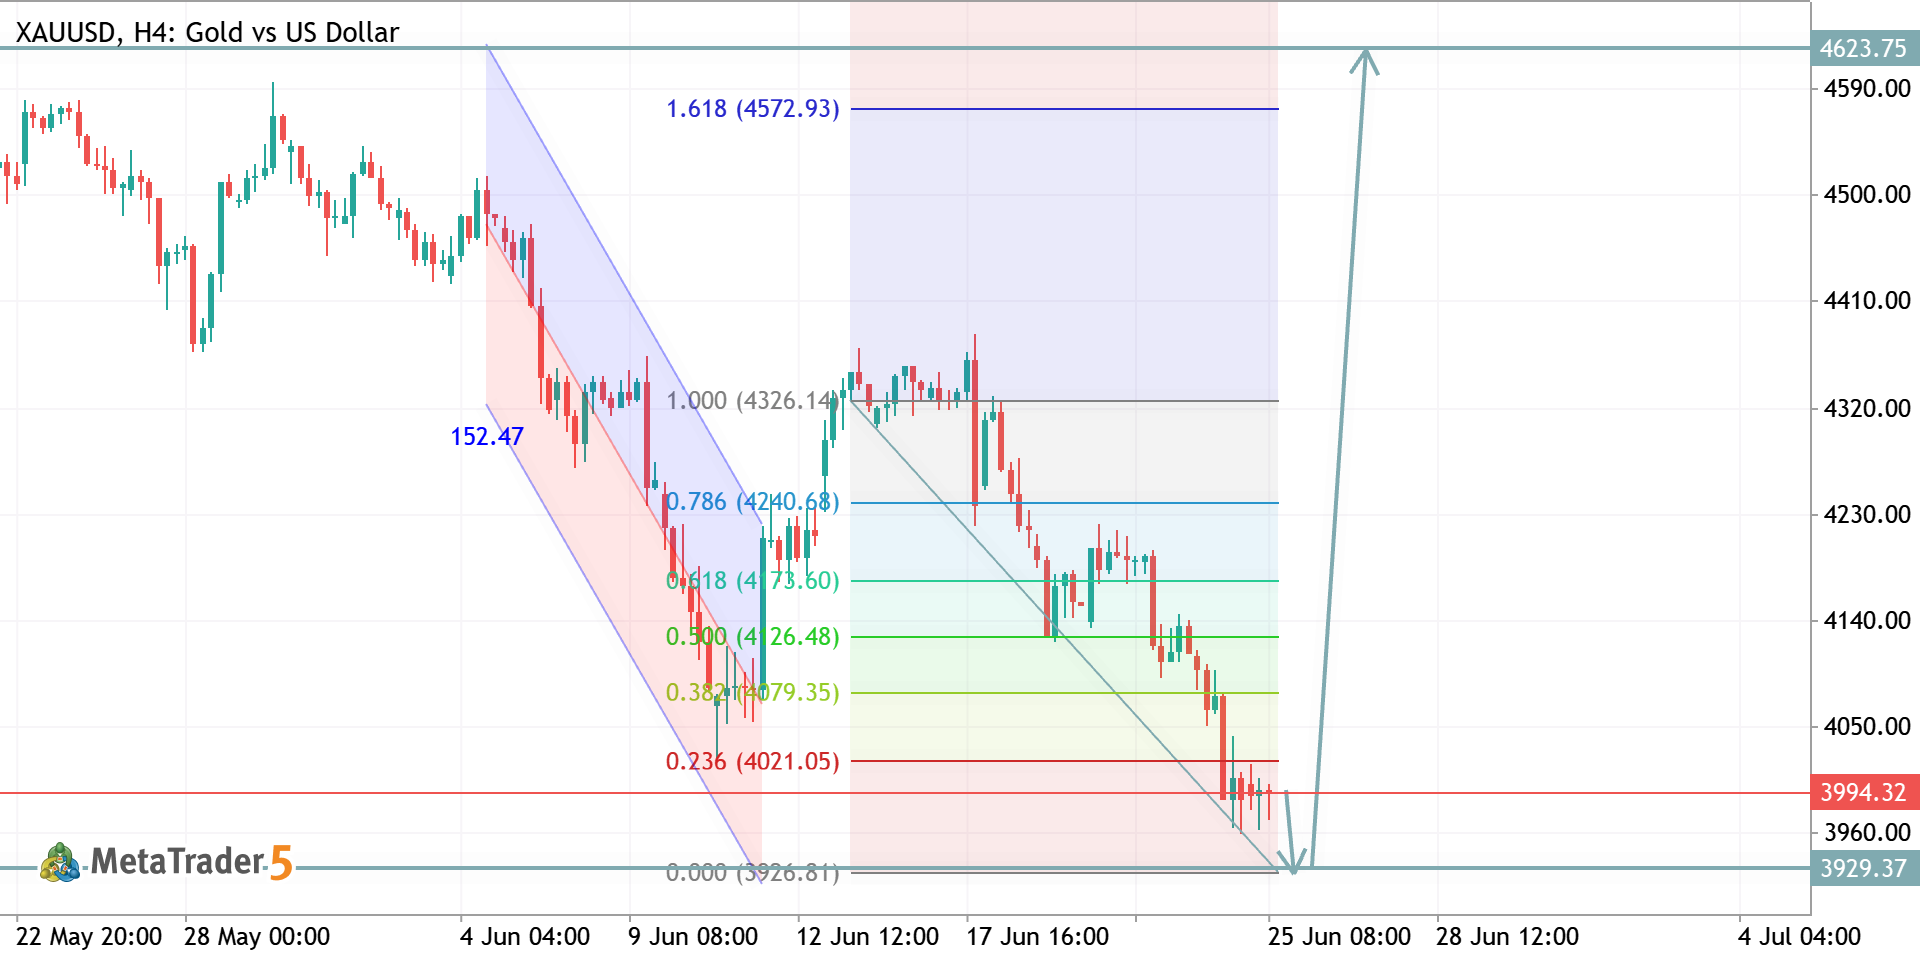
XAUUSD H4 Analysis Gold remains under bearish pressure after breaking below key Fibonacci support. Price is currently testing the 3929–4000 demand zone, where a potential liquidity sweep could trigger a strong reversal. 📉 Bearish scenario: A confirmed break below 3929 may extend the decline. 📈 Bullish scenario: Holding above current support could fuel a recovery toward 4327, with an extended target near 4574 (1.618 Fib level). Key Levels: Support: 3929 Resistance: 4327 Bullish Target: 4574 Watch for bullish confirmation before considering long positions. Risk management remains essential.
8
Goldanalysisteam Abdul Qayoom 2026.06.25 08:50
BTCUSD H1 ANALYSIS BTCUSD Bitcoin vs US Dollar
BTCUSD H1 ANALYSIS
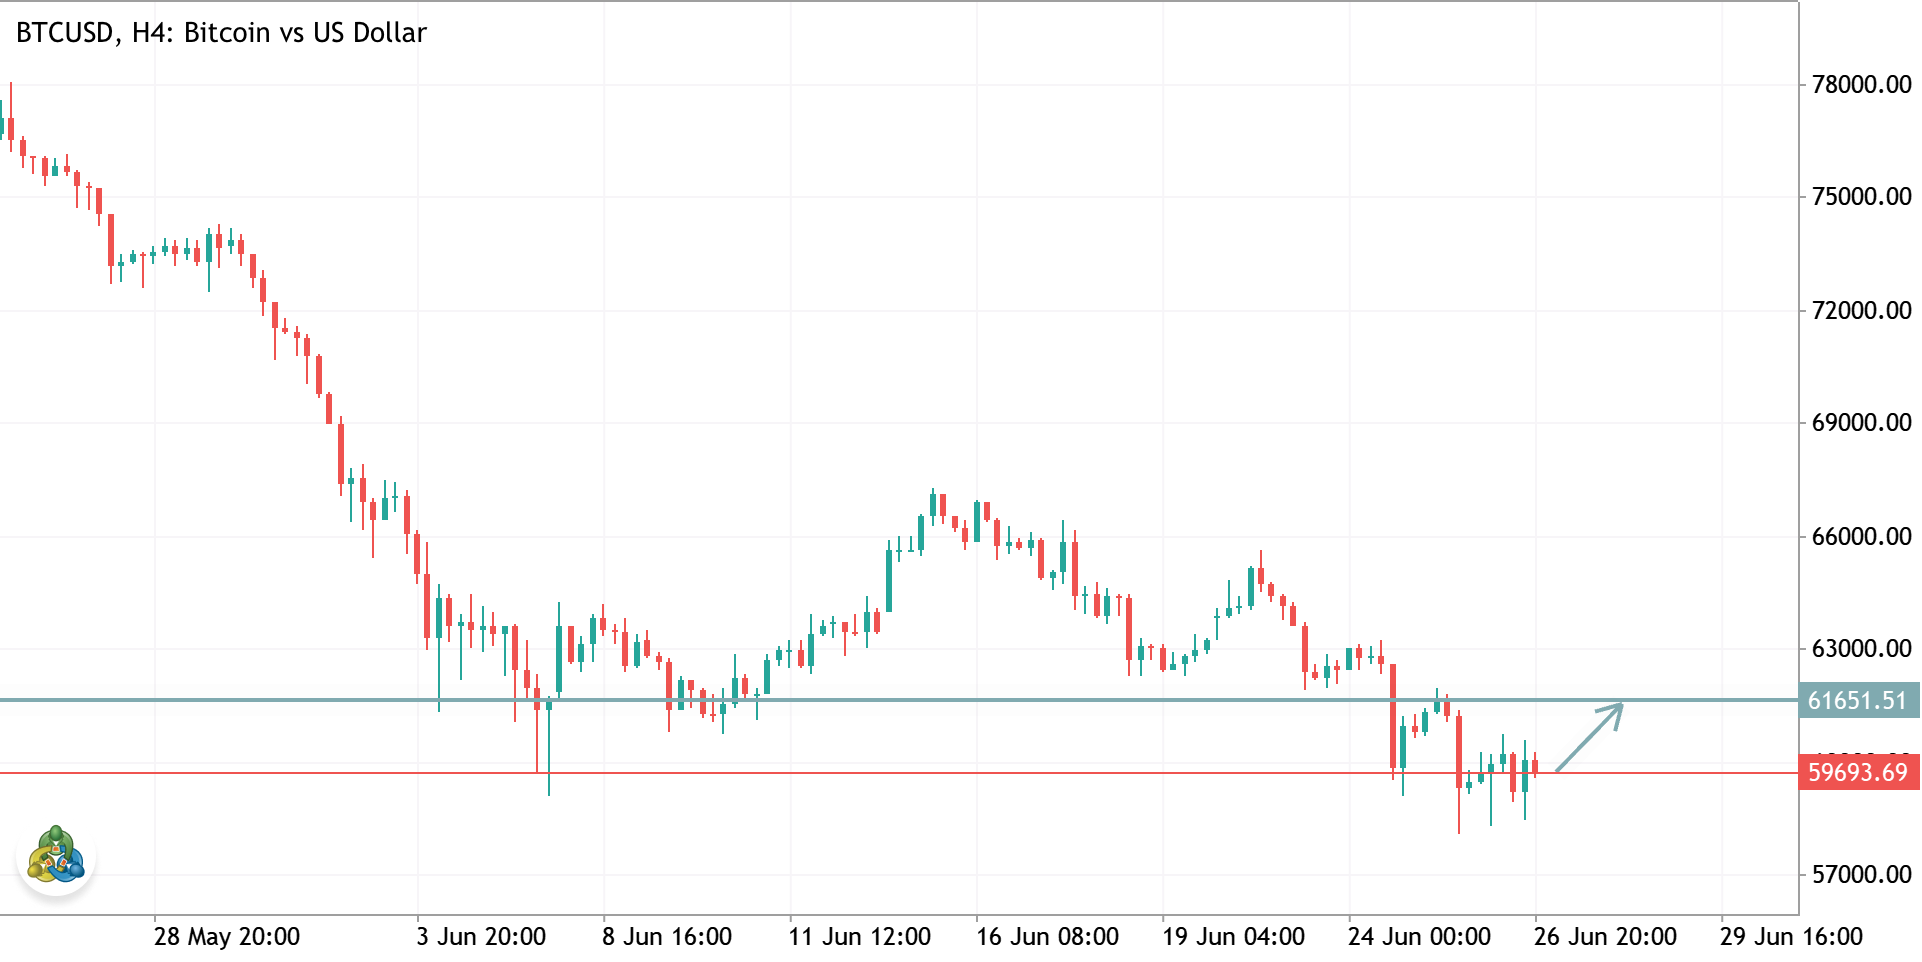
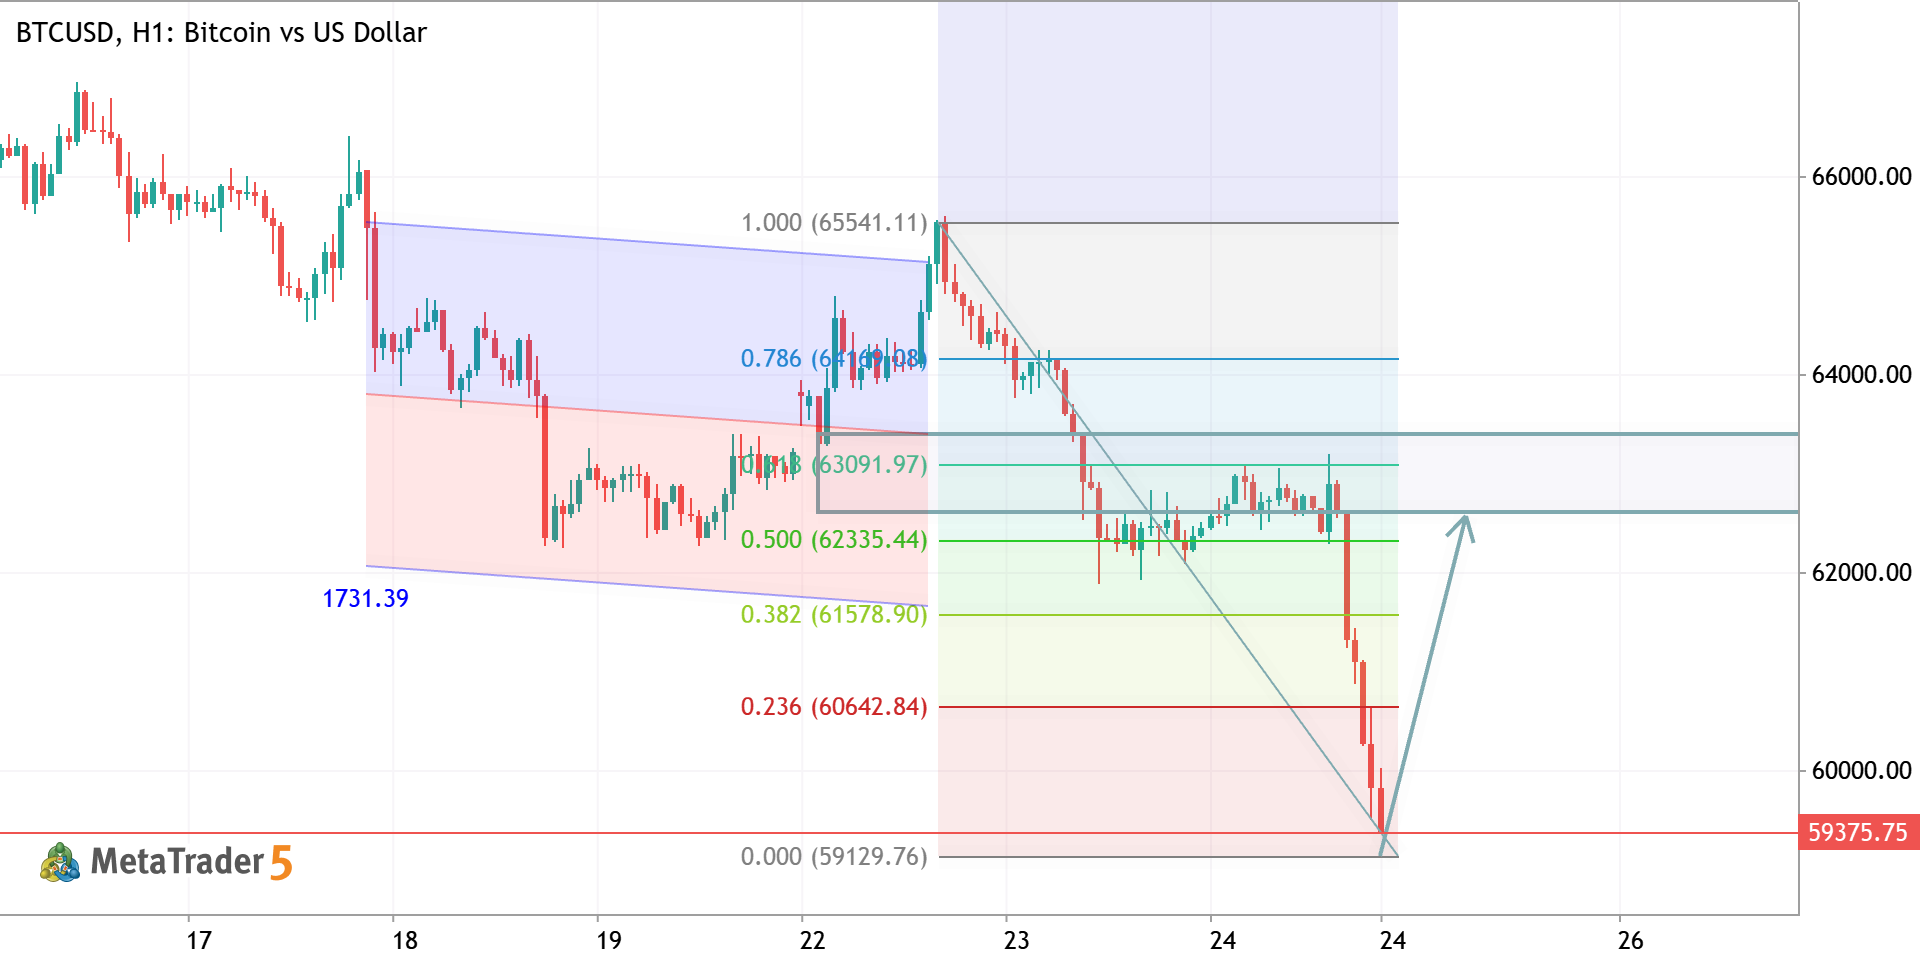
BTCUSD H1 Analysis BTCUSD has reached a key support zone after a sharp bearish move. Price is reacting near the Fibonacci retracement support and showing signs of a potential bullish rebound. A successful hold above the current low could trigger a recovery toward the 61.8%–78.6% Fibonacci resistance area. However, a break below support may extend the downtrend. Bias: Bullish Recovery Above Support Key Resistance: 60,500 – 62,300 Key Support: 58,700 – 59,200 Trade with proper risk management. This analysis is for educational purposes only and not financial advice.
0
Goldanalysisteam Abdul Qayoom 2026.06.24 17:50
XAUUSD H1 ANALYSIS XAUUSD Gold vs US Dollar
XAUUSD H1 ANALYSIS
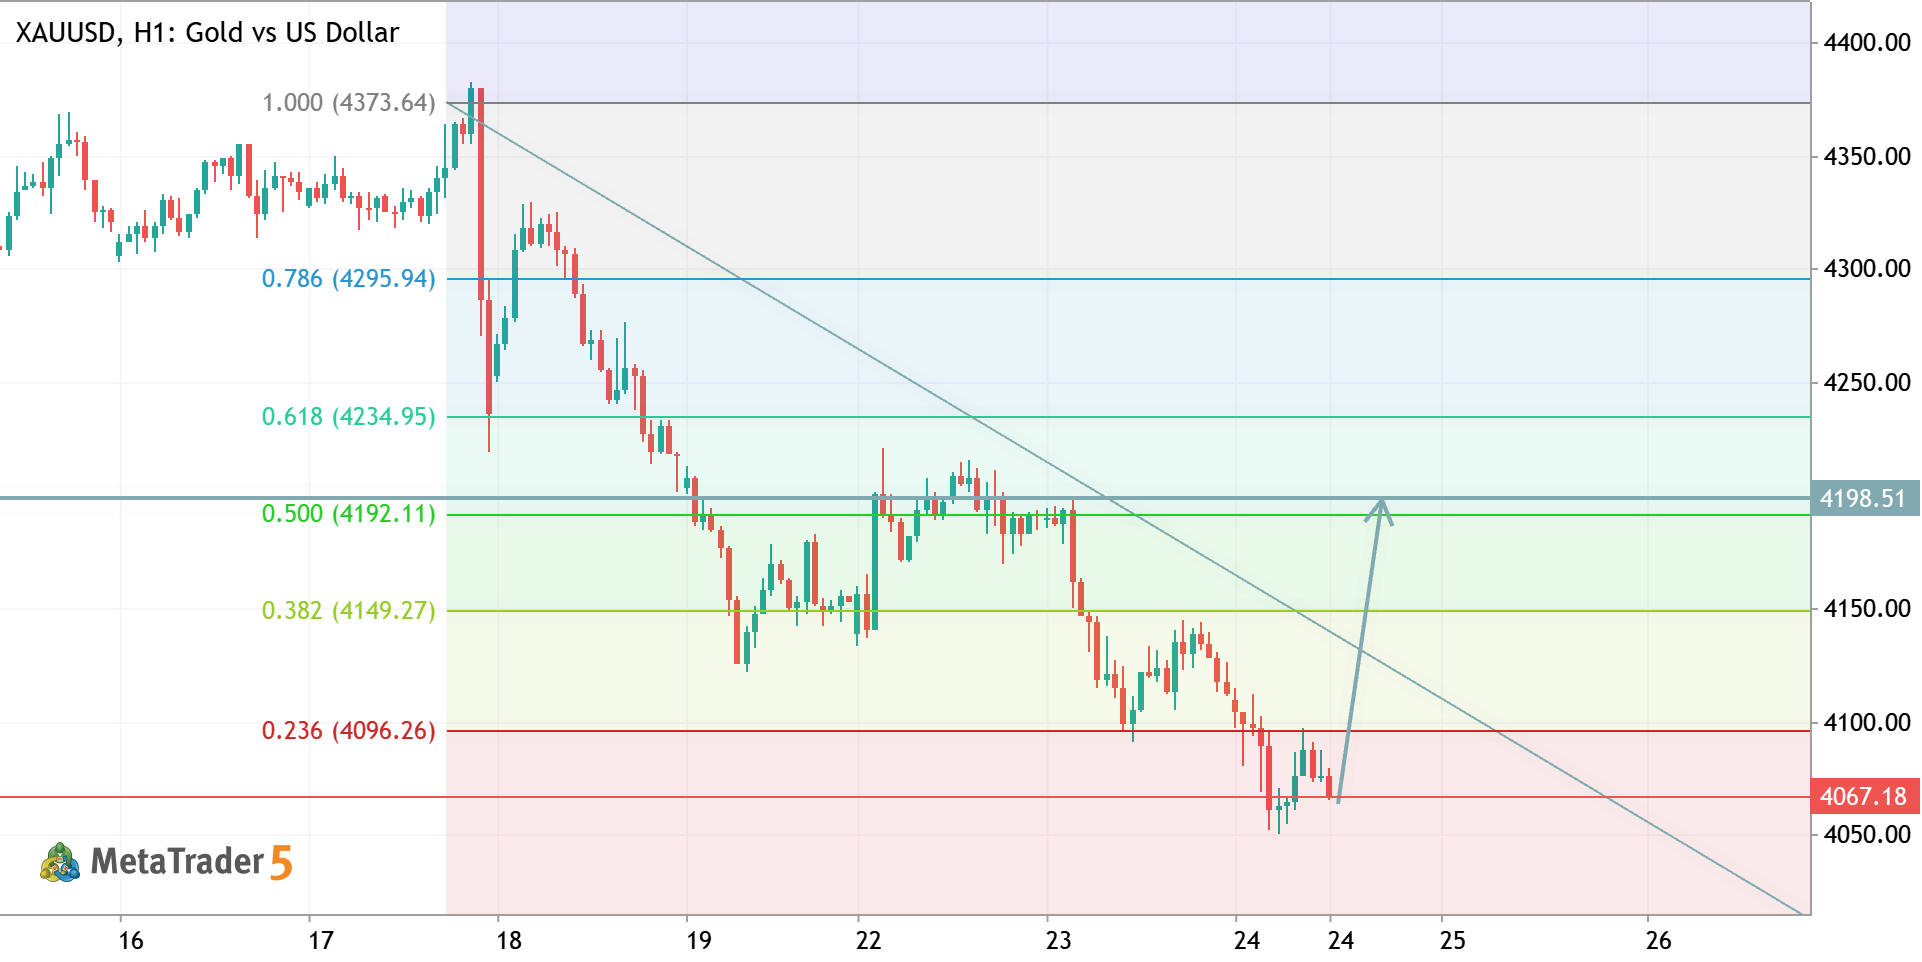
XAUUSD H1 Analysis Gold remains under pressure but is approaching a major support zone near 4050. Price is trading below the descending trendline, yet a strong reaction from support could trigger a corrective rally toward the 4190–4235 resistance area. Bias: Bullish Correction Expected Key Support: 4050 – 4020 Key Resistance: 4190 – 4235 Watch for bullish confirmation at support before entering. Proper risk management is essential.
1
Goldanalysisteam Abdul Qayoom 2026.06.24 09:50