
Tickers relacionados
| # | Nome | Preços | 24h % | 7d % | 1M % | 1A % | Últimos 7 dias | |
|---|---|---|---|---|---|---|---|---|
| 1 | LTCUSD Litecoin vs US Dollar | 58.90 USD | -3.14% | -10.35% | +9.91% | -38.73% | ||
| 2 | ETHUSD Ethereum vs US Dollar | 2420.80 USD | -3.05% | -5.91% | -5.79% | -41.09% | ||
| 3 | MBTUSD milliBitcoin vs US Dollar | 81.549 USD | -1.79% | -1.97% | +3.51% | -27.74% | ||
| 4 | ETCUSD Ethereum Classic vs US Dollar | 7.935 USD | -1.71% | -5.96% | +3.46% | -52.96% |
Notícias
Economista com mais de 1 milhão de livros vendidos cita João Paulo Mayall ao lado de Fidelity e Schwab em defesa do bitcoin
Inflação americana dispara e volta a pressionar o Bitcoin
Bitcoin Hoje 14/10: Inflação Reacende Medo de Alta de Juros
Bitcoin (BTC) oscila com cautela antes do CPI, enquanto Standard Chartered amplia oferta cripto nos EAU
Bitcoin está preparado para a computação quântica? O plano da Coinbase
Tether anuncia investimento na EFY Finance para ampliar uso de stablecoins na América Latina
BTC/USD Hoje 14/10: Aposta Saylor Coloca $100.000 em Foco
Forex Hoje 14/10: Dólar Recua e Petróleo Aumenta a Pressão
Bitcoin estável em US$ 83 mil enquanto mercados aguardam dados de inflação dos EUA
Justiça manda Nubank revelar todas as transações de criptomoedas em conta de cliente após julgado à revelia
Justiça do Reino Unido dificulta recuperação de 61 mil bitcoins por vítimas de fraude na China
Gráficos e ideias
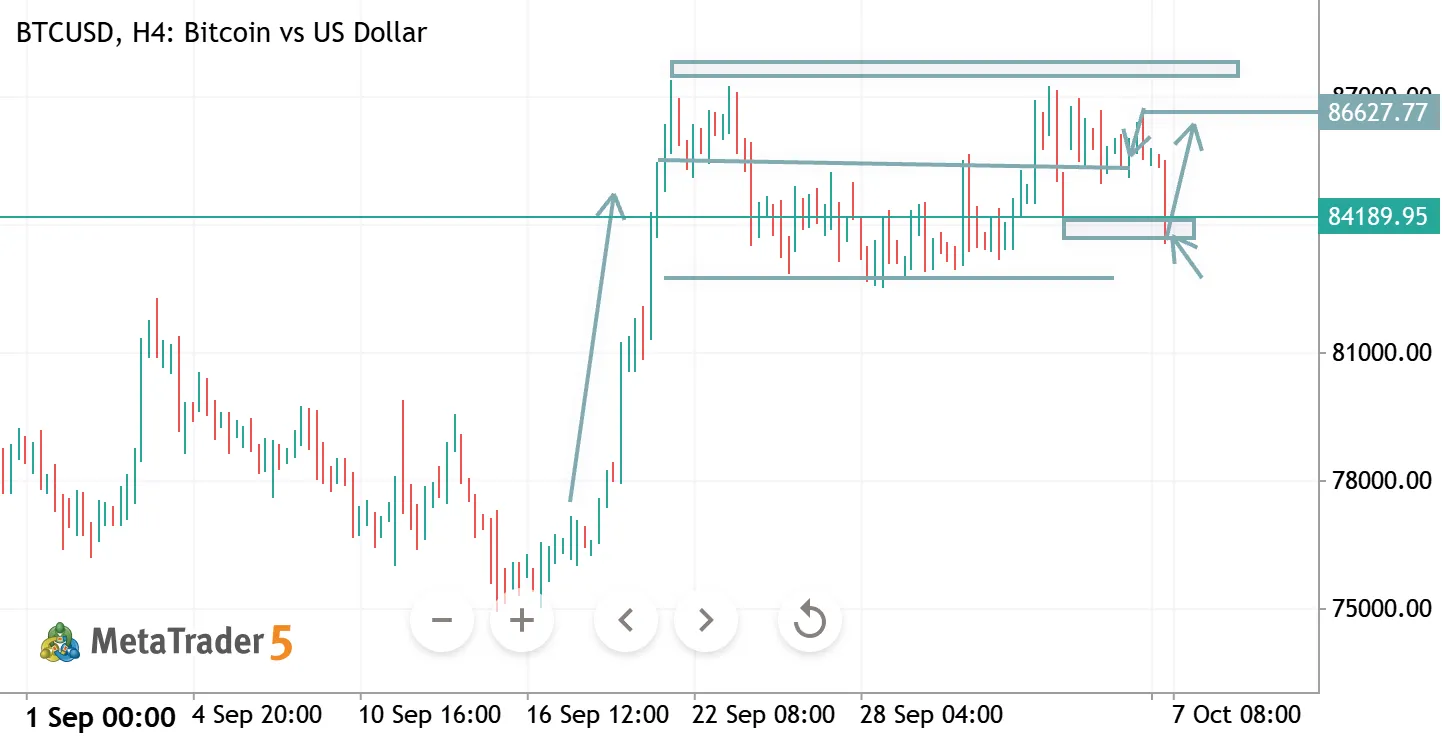
BTCUSD H4 ANALYSIS
BTCUSD H4 Analysis
BTC is consolidating near 84,100 after a strong recovery. The 84,000–84,500 zone is key support; holding above it could push price back toward 86,700–88,000.
🔹 Support: 84,000–84,500 🔹 Resistance: 86,700–88,000 🔹 Bias: Bullish above 84,000 🔹 Key Trigger: Break above 86,700 → upside continuation.

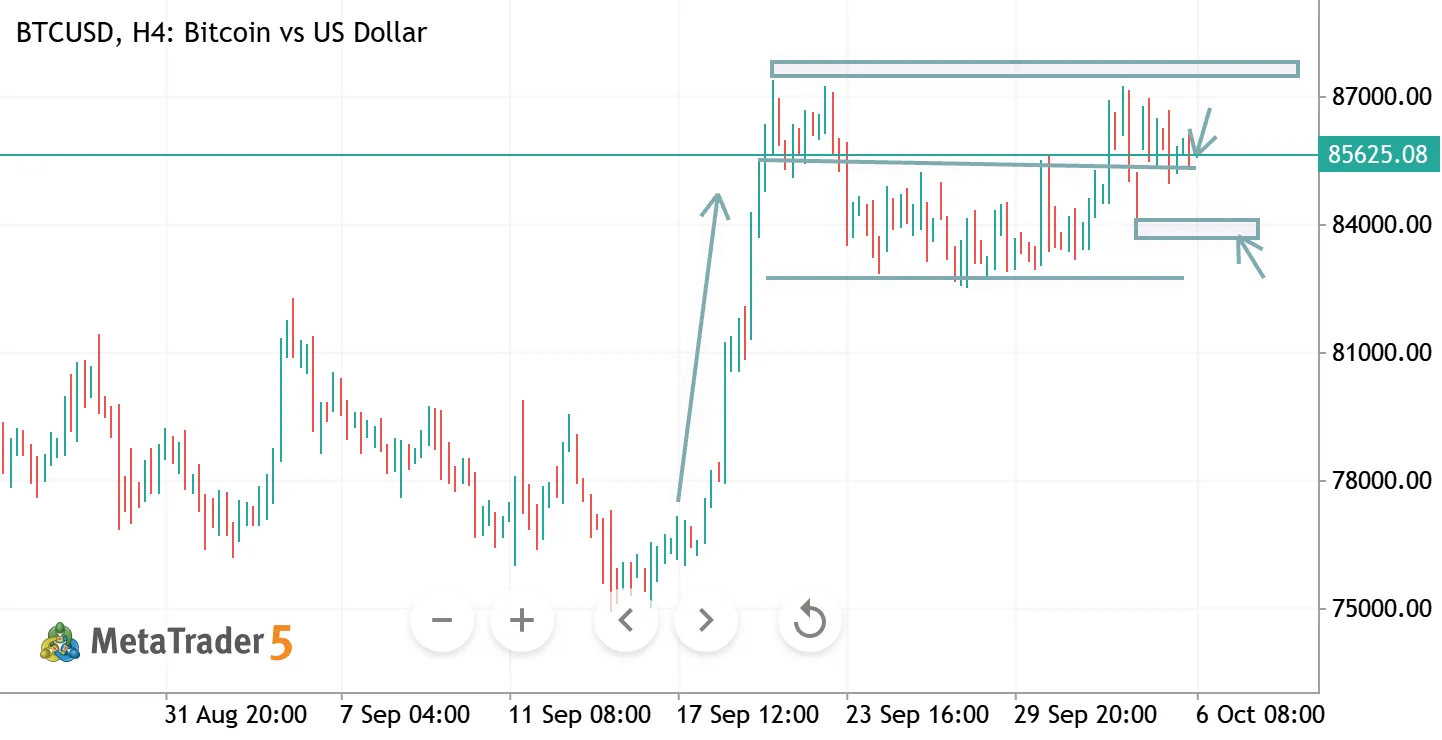
BTCUSD H4 ANALYSIS
BTCUSD H4 Analysis
BTC is consolidating below the 86,000–87,000 resistance zone after a strong recovery. A breakout above this area could resume the bullish move toward 88,000, while rejection may pull price back toward 84,000–82,500.
🔹 Resistance: 86,000–87,000 🔹 Support: 84,000–82,500 🔹 Bias: Bullish above 84,000 🔹 Key Trigger: H4 close above 87,000 → upside continuation.
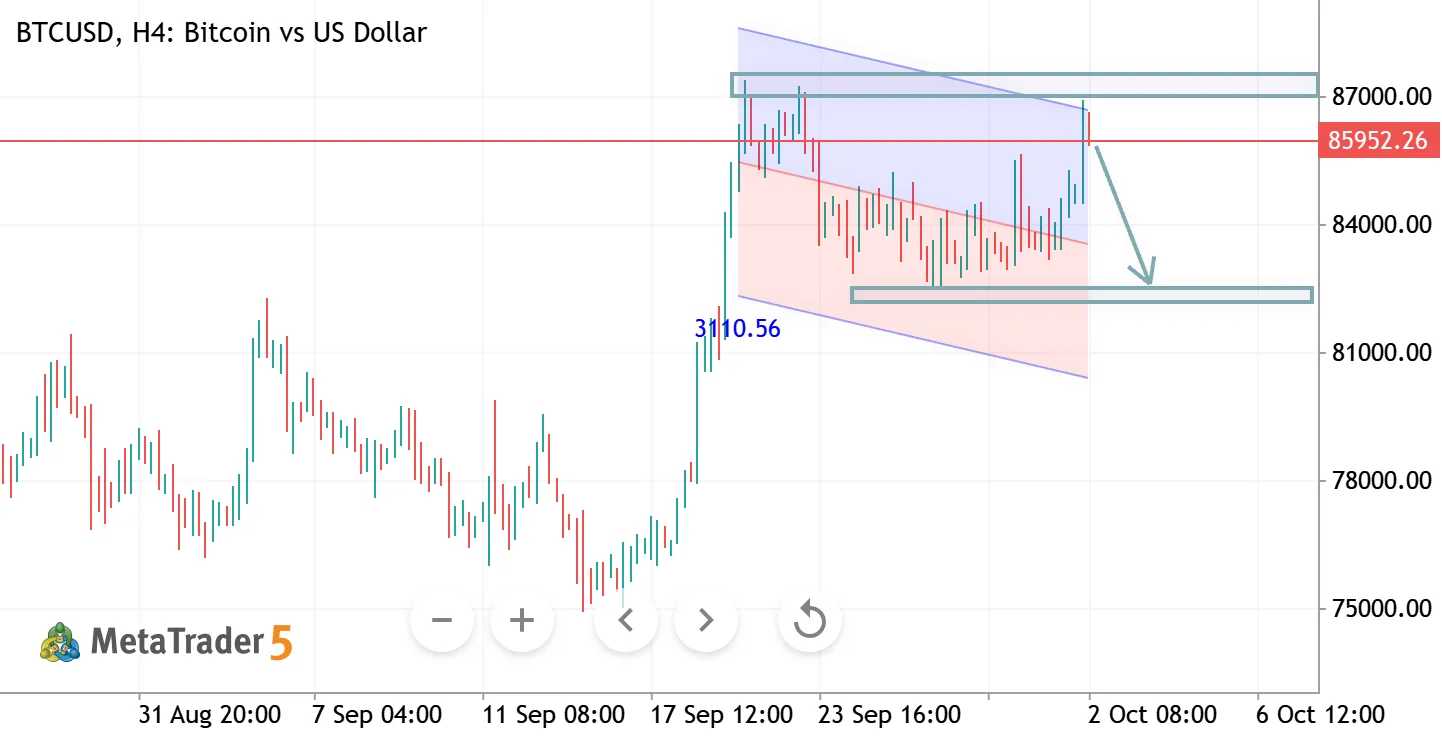
BTCUSD H4 ANALYSIS
BTCUSD H4 Analysis Bitcoin is testing a major resistance zone around 85,800–86,500 after a strong recovery. Rejection here could trigger a pullback toward the 82,000 support zone. 🔹 Resistance: 85,800–86,500 🔹 Support: 82,000–82,500 🔹 Bias: Bearish below 86,500 🔹 Key Trigger: Break above 86,500 → bullish continuation; rejection → downside toward 82,000.
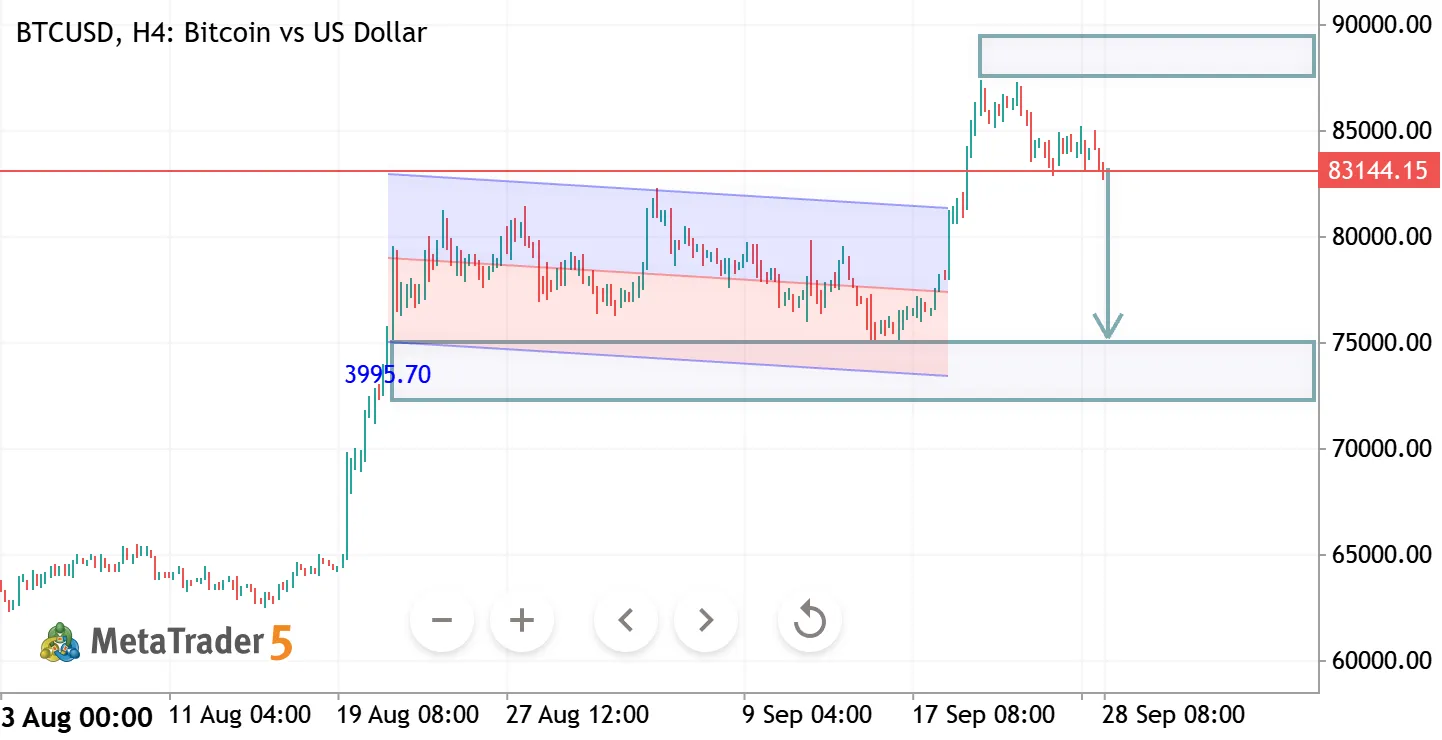
BTCUSD H4 ANALYSIS
GBPUSD – Technical Analysis 📊
GBPUSD is showing signs of a potential bullish reversal after moving within a descending channel. Price is holding around 1.3230, with the chart indicating a possible move toward the 1.3380–1.3400 resistance zone.
🔹 Support: 1.3200–1.3230 🔹 Target Zone: 1.3380–1.3400 🔹 Key Level: Sustained strength above 1.3260 would support the bullish setup.
Disclaimer: Technical analysis is based on chart structure and is not financial advice.
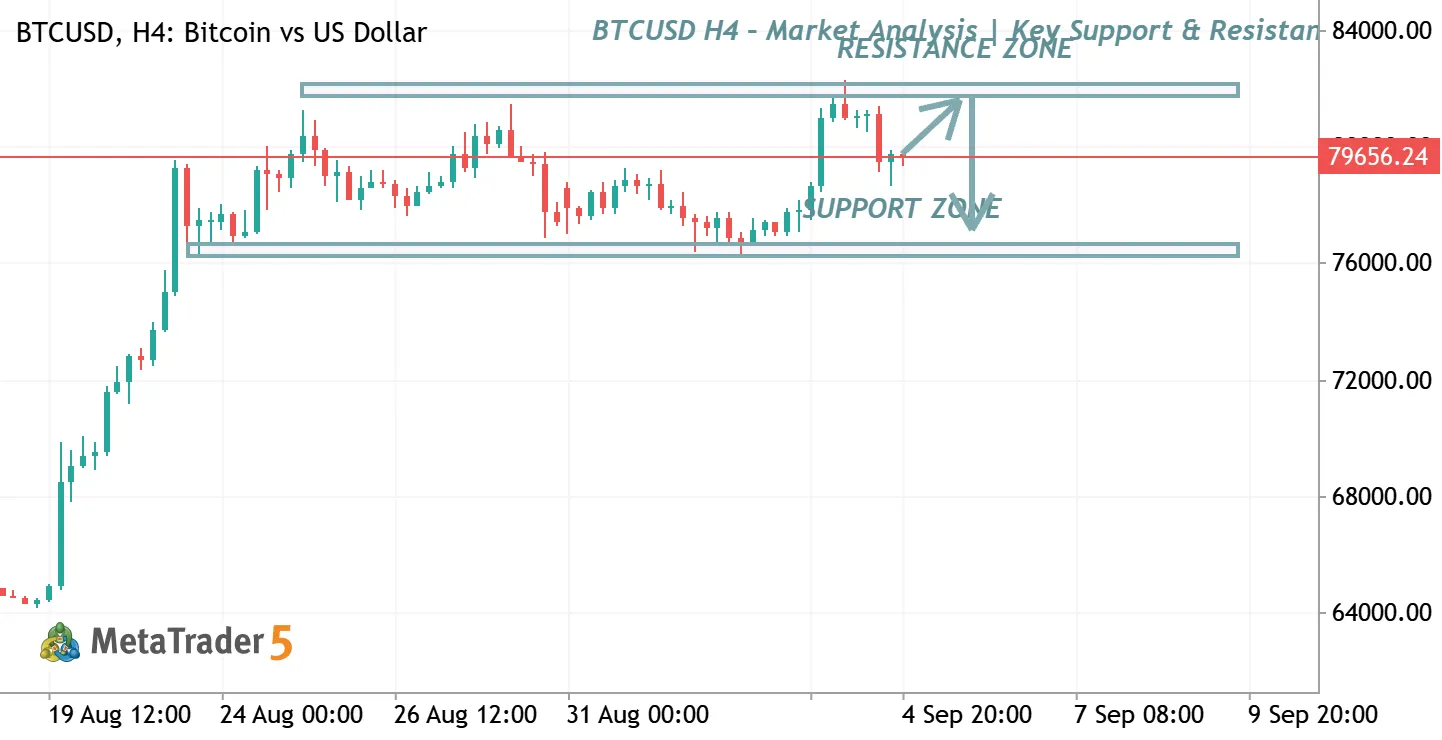
BTCUSD H4 – Market Analysis | Key Support & Resistance
BTCUSD is currently trading between important support and resistance zones on the H4 timeframe. Price is approaching a critical area where traders should watch for confirmation of either a bullish breakout toward the resistance zone or a bearish rejection toward support . 📈 Bullish Scenario: Break and hold above resistance may open the way for further upside.
📉 Bearish Scenario: Rejection from resistance could lead price back toward the major support zone. ⚠️ Trade with proper risk management and wait for confirmation before entering

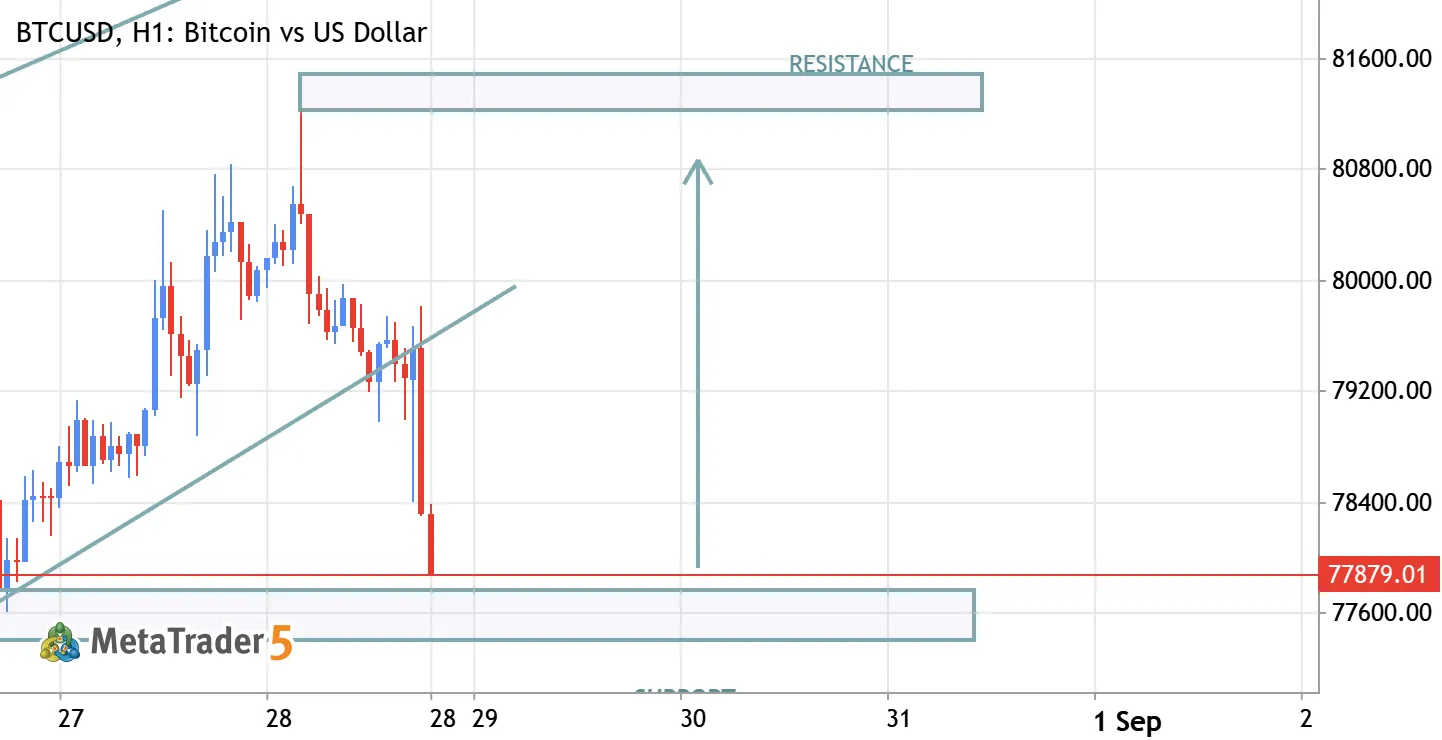
BTCUSD BULLISH TREND AFTER SUPPORT
BTCUSD BULLISH FROM SUPPORT TARGETS 81600


No momento, não há outras ideias de trading para BTCUSD
Veja ideias de trading prontas ou selecione um símbolo e crie a sua
Ir para gráficos e ideias de trading