In this article, we will cover some of the measures and precautions to consider when creating a communication protocol. These are pretty simple and straightforward things, so we won't go into too much detail in this article. But to understand what will happen, you need to understand the content of the article.
We explore how to manipulate databases in MQL5 using the language's native functions. We cover everything from table creation, insertion, updating, and deletion to data import and export, all with sample code. The content serves as a solid foundation for understanding the internal mechanics of data access, paving the way for the discussion of ORM, where we'll build one in MQL5.
Trends are an important part of many trading strategies. In this article, we will look at some of the tools used to identify trends and their characteristics. Understanding and correctly interpreting trends can significantly improve trading efficiency and minimize risks.
We are introducing MQL5 Algo Forge — a dedicated portal for algorithmic trading developers. It combines the power of Git with an intuitive interface for managing and organizing projects within the MQL5 ecosystem. Here, you can follow interesting authors, form teams, and collaborate on algorithmic trading projects.
In this article, we develop a Bat Pattern system in MQL5 that identifies bullish and bearish Bat harmonic patterns using pivot points and Fibonacci ratios, triggering trades with precise entry, stop loss, and take-profit levels, enhanced with visual feedback through chart objects
Continuing tries to decipher price movements... What about linguistic analysis of the "market dictionary" that we get by converting the binary price code to BIP39? In this article, we will delve into an innovative approach to exchange data analysis and consider how modern natural language processing techniques can be applied to the market language.
I invite you to get acquainted with the Multi-Agent Self-Adaptive (MASA) framework, which combines reinforcement learning and adaptive strategies, providing a harmonious balance between profitability and risk management in turbulent market conditions.
The article provides a detailed discussion of the key components and innovations of the ATA optimization algorithm, which is an evolutionary method with a unique dual behavior system that adapts depending on the situation. ATA combines individual and social learning while using crossover for explorations and migration to find solutions when stuck in local optima.
This article presents an innovative approach to technical analysis based on converting price movements into binary code. The author demonstrates how various aspects of market behavior — from simple price movements to complex patterns — can be encoded in a sequence of zeros and ones.
Financial markets are unpredictable, and trading strategies that look profitable in the past often collapse in real market conditions. This happens because most strategies are fixed once deployed and cannot adapt or learn from their mistakes. By borrowing ideas from control theory, we can use feedback controllers to observe how our strategies interact with markets and adjust their behavior toward profitability. Our results show that adding a feedback controller to a simple moving average strategy improved profits, reduced risk, and increased efficiency, proving that this approach has strong potential for trading applications.
In this article, we explore the fundamentals of harmonic patterns, their structures, and how they are applied in trading. You’ll learn about Fibonacci retracements, extensions, and how to implement harmonic pattern detection in MQL5, setting the foundation for building advanced trading tools and Expert Advisors.
This article presents a sample MQL5 Service implementation for updating a newly created database used as source for data analysis and for trading a basket of cointegrated stocks. The rationale behind the database design is explained in detail and the data dictionary is documented for reference. MQL5 and Python scripts are provided for the database creation, schema initialization, and market data insertion.
News trading often requires managing multiple positions and symbols within a very short time due to heightened volatility. In today’s discussion, we address the challenges of multi-symbol trading by integrating this feature into our News Headline EA. Join us as we explore how algorithmic trading with MQL5 makes multi-symbol trading more efficient and powerful.
Human traders had long participated in financial markets before the rise of computers, developing rules of thumb that guided their decisions. In this article, we revisit a well-known breakout strategy to test whether such market logic, learned through experience, can hold its own against systematic methods. Our findings show that while the original strategy produced high accuracy, it suffered from instability and poor risk control. By refining the approach, we demonstrate how discretionary insights can be adapted into more robust, algorithmic trading strategies.
In this article, we will take a very close look at how to solve the problem posed at the end of the previous article. There was an attempt to create a template of such type so that to be able to create a template for data union.
In this second installment of the MetaTrader 5 Machine Learning Blueprint series, you’ll discover why simple labels can lead your models astray—and how to apply advanced techniques like the Triple-Barrier and Trend-Scanning methods to define robust, risk-aware targets. Packed with practical Python examples that optimize these computationally intensive techniques, this hands-on guide shows you how to transform noisy market data into reliable labels that mirror real-world trading conditions.
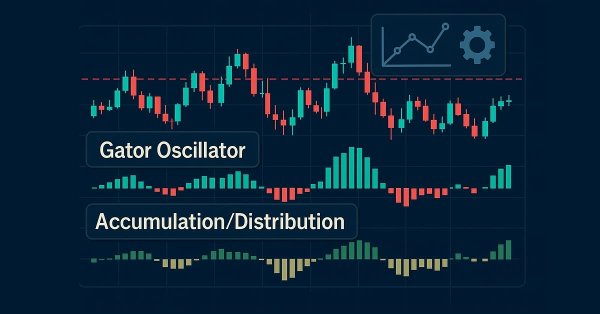
In the last piece, we concluded our look at the pairing of the gator oscillator and the accumulation/distribution oscillator when used in their typical setting of the raw signals they generate. These two indicators are complimentary as trend and volume indicators, respectively. We now follow up that piece, by examining the effect that supervised learning can have on enhancing some of the feature patterns we had reviewed. Our supervised learning approach is a CNN that engages with kernel regression and dot product similarity to size its kernels and channels. As always, we do this in a custom signal class file that works with the MQL5 wizard to assemble an Expert Advisor.
Market sentiment is one of the most overlooked yet powerful forces influencing price movement. While most traders rely on lagging indicators or guesswork, the Sentiment Tilt Meter (STM) EA transforms raw market data into clear, visual guidance, showing whether the market is leaning bullish, bearish, or staying neutral in real-time. This makes it easier to confirm trades, avoid false entries, and time market participation more effectively.
This article offers a step-by-step guide to mastering CRUD (Create, Read, Update, Delete) operations in Firebase, focusing on its Realtime Database and Firestore. Discover how to use Firebase SDK methods to efficiently manage data in web and mobile apps, from adding new records to querying, modifying, and deleting entries. Explore practical code examples and best practices for structuring and handling data in real-time, empowering developers to build dynamic, scalable applications with Firebase’s flexible NoSQL architecture.
In this article, we will discuss the first part of the topic, which is not so easy for beginners to understand. In order not to get even more confused and to explain this topic correctly, we will divide the explanation into stages. We will devote this article to the first stage. However, although at the end of the article it may seem that we have reached the deadlock, in fact we will take a step towards another situation, which will be better understood in the next article.
In this article, we develop a Crab Harmonic Pattern system in MQL5 that identifies bullish and bearish Crab harmonic patterns using pivot points and Fibonacci ratios, triggering trades with precise entry, stop loss, and take-profit levels. We incorporate visual feedback through chart objects like triangles and trendlines to display the XABCD pattern structure and trade levels.
This article explains how to deal with one of the most difficult programming situations you can encounter: using different types in the same function or procedure template. Although we have spent most of our time focusing only on functions, everything covered here is useful and can be applied to procedures.
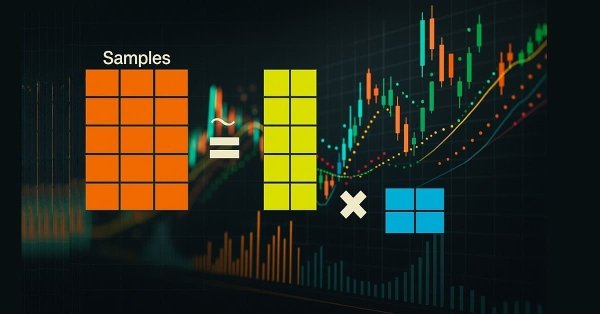
This article explores the powerful role of matrix factorization in algorithmic trading, specifically within MQL5 applications. From regression models to multi-target classifiers, we walk through practical examples that demonstrate how easily these techniques can be integrated using built-in MQL5 functions. Whether you're predicting price direction or modeling indicator behavior, this guide lays a strong foundation for building intelligent trading systems using matrix methods.
In this article, we develop a Pin Bar Averaging system in MQL5 that detects pin bar patterns to initiate trades and employs an averaging strategy for multi-position management, enhanced by trailing stops and breakeven adjustments. We incorporate customizable parameters with a dashboard for real-time monitoring of positions and profits.
In this article, we start considering one of the concepts that many beginners avoid. This is related to the fact that templates are not an easy topic, as many do not understand the basic principle underlying the template: overload of functions and procedures.
This article is a brief introduction to the concept of floating-point numbers. Since this text is very complex please, read it attentively and carefully. Do not expect to quickly master the floating-point system. It only becomes clear over time, as you gain experience using it. But this article will help you understand why your application sometimes produces results different from what you expect.
Perhaps this article will be the most confusing for novice programmers. As a matter of fact, here I will show that it is not always that all functions and procedures have unique names in the same code. Yes, we can easily use functions and procedures with the same name — and this is called overload.
In this article, we will continue our awareness of #define directive, but this time we will focus on its second form of use, that is, creating macros. Since this subject can be a bit complicated, we decided to use an application that we have been studying for some time. I hope you enjoy today's article.
We will explore how the Parabolic SAR and the Fractal indicator can be combined to create a new oscillator-based indicator. By integrating the unique strengths of both tools, traders can aim at developing a more refined and effective trading strategy.
In the previous work, we discussed the theoretical aspects of the PSformer framework, which includes two major innovations in the classical Transformer architecture: the Parameter Shared (PS) mechanism and attention to spatio-temporal segments (SegAtt). In this article, we continue the work we started on implementing the proposed approaches using MQL5.
In this article we will do things that many will find strange and completely out of context, but which, if used correctly, will make your learning much more fun and interesting: we will be able to build quite interesting things based on what is shown here. This will allow you to better understand the syntax of the MQL5 language. The materials provided here are for educational purposes only. It should not be considered in any way as a final application. Its purpose is not to explore the concepts presented.
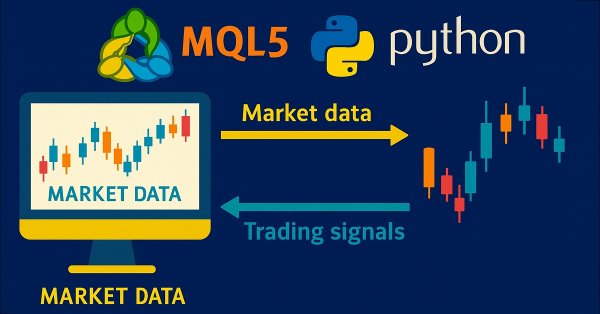
Harness the full potential of your MetaTrader 5 terminal by leveraging Python’s data-science ecosystem and the official MetaTrader 5 client library. This article demonstrates how to authenticate and stream live tick and minute-bar data directly into Parquet storage, apply sophisticated feature engineering with Ta and Prophet, and train a time-aware Gradient Boosting model. We then deploy a lightweight Flask service to serve trade signals in real time. Whether you’re building a hybrid quant framework or enhancing your EA with machine learning, you’ll walk away with a robust, end-to-end pipeline for data-driven algorithmic trading.
In this article, we'll look at how the code of DispatchMessage, missing from the previous article, works. We will laso introduce the topic of the next article. For this reason, it is important to understand how this code works before moving on to the next topic. The content presented here is intended solely for educational purposes. Under no circumstances should the application be viewed for any purpose other than to learn and master the concepts presented.
This article introduces the new PSformer framework, which adapts the architecture of the vanilla Transformer to solving problems related to multivariate time series forecasting. The framework is based on two key innovations: the Parameter Sharing (PS) mechanism and the Segment Attention (SegAtt).
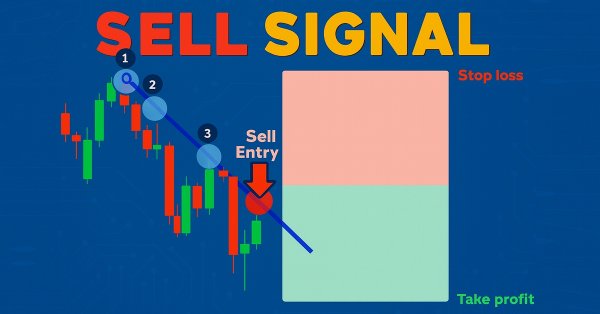
In this article, we develop a trendline trader program that uses least squares fit to detect support and resistance trendlines, generating dynamic buy and sell signals based on price touches and open positions based on generated signals.
This part focuses on building a flexible, adaptive trading model trained on historical XAUUSD data, preparing it for ONNX export and potential integration into live trading systems.
SAMformer offers a solution to the key drawbacks of Transformer models in long-term time series forecasting, such as training complexity and poor generalization on small datasets. Its shallow architecture and sharpness-aware optimization help avoid suboptimal local minima. In this article, we will continue to implement approaches using MQL5 and evaluate their practical value.
This phase fine-tunes your multi-pair EA to adapt trade size and risk in real time using volatility metrics like ATR boosting consistency, protection, and performance across diverse market conditions.
We created a log suppression system in the Logify library. It details how the CLogifySuppression class reduces console noise by applying configurable rules to avoid repetitive or irrelevant messages. We also cover the external configuration framework, validation mechanisms, and comprehensive testing to ensure robustness and flexibility in log capture during bot or indicator development.
In this article, we develop an enhanced informational dashboard that upgrades the previous part by adding draggable and minimizable features for improved user interaction, while maintaining real-time monitoring of multi-symbol positions and account metrics.