Unlike what was done in the previous article, here we will test the selection option using an Expert Advisor. Although this is not a final solution yet, it will be enough for now. With the help of this article, you will be able to understand how to implement one of the possible solutions.
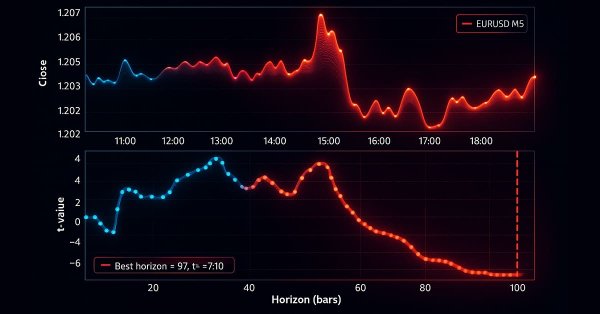
We have built a robust feature engineering pipeline using proper tick-based bars to eliminate data leakage and solved the critical problem of labeling with meta-labeled triple-barrier signals. This installment covers the advanced labeling technique, trend-scanning, for adaptive horizons. After covering the theory, an example shows how trend-scanning labels can be used with meta-labeling to improve on the classic moving average crossover strategy.
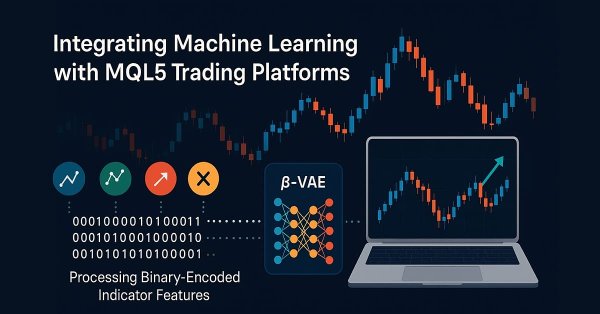
This piece follows up ‘Part-80’, where we examined the pairing of Ichimoku and the ADX under a Reinforcement Learning framework. We now shift focus to Inference Learning. Ichimoku and ADX are complimentary as already covered, however we are going to revisit the conclusions of the last article related to pipeline use. For our inference learning, we are using the Beta algorithm of a Variational Auto Encoder. We also stick with the implementation of a custom signal class designed for integration with the MQL5 Wizard.
We continue our examination of the StockFormer hybrid trading system, which combines predictive coding and reinforcement learning algorithms for financial time series analysis. The system is based on three Transformer branches with a Diversified Multi-Head Attention (DMH-Attn) mechanism that enables the capturing of complex patterns and interdependencies between assets. Previously, we got acquainted with the theoretical aspects of the framework and implemented the DMH-Attn mechanisms. Today, we will talk about the model architecture and training.
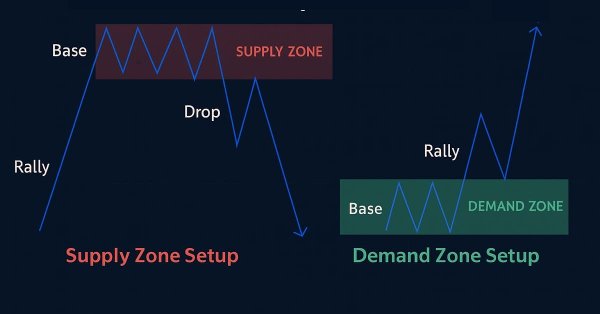
In this article, we create a supply and demand trading system in MQL5 that identifies supply and demand zones through consolidation ranges, validates them with impulsive moves, and trades retests with trend confirmation and customizable risk parameters. The system visualizes zones with dynamic labels and colors, supporting trailing stops for risk management.
In this article, you will learn how to develop an Order Blocks indicator based on order book volume (market depth) and optimize it using buffers to improve accuracy. This concludes the current stage of the project and prepares for the next phase, which will include the implementation of a risk management class and a trading bot that uses signals generated by the indicator.
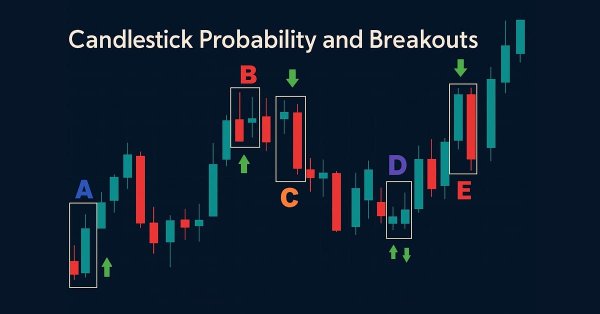
Enhance your market analysis with the MQL5-native Candlestick Probability EA, a lightweight tool that transforms raw price bars into real-time, instrument-specific probability insights. It classifies Pinbars, Engulfing, and Doji patterns at bar close, uses ATR-aware filtering, and optional breakout confirmation. The EA calculates raw and volume-weighted follow-through percentages, helping you understand each pattern's typical outcome on specific symbols and timeframes. On-chart markers, a compact dashboard, and interactive toggles allow easy validation and focus. Export detailed CSV logs for offline testing. Use it to develop probability profiles, optimize strategies, and turn pattern recognition into a measurable edge.
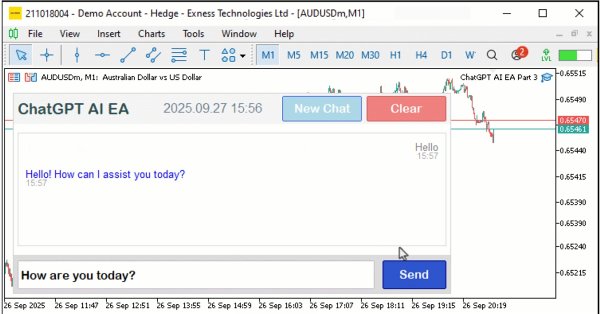
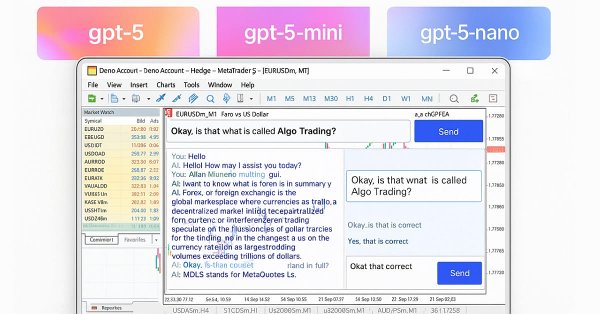
In this article, we upgrade the ChatGPT-integrated program in MQL5 to a scrollable single chat-oriented UI, enhancing conversation history display with timestamps and dynamic scrolling. The system builds on JSON parsing to manage multi-turn messages, supporting customizable scrollbar modes and hover effects for improved user interaction.
We will look at price discretization methods using Python + MQL5. In this article, I will share my practical experience developing a Python library that implements a wide range of approaches to bar formation — from classic Volume and Range bars to more exotic methods like Renko and Kagi. We will consider three-line breakout candles and range bars analyzing their statistics and trying to define how else the prices can be represented discretely.
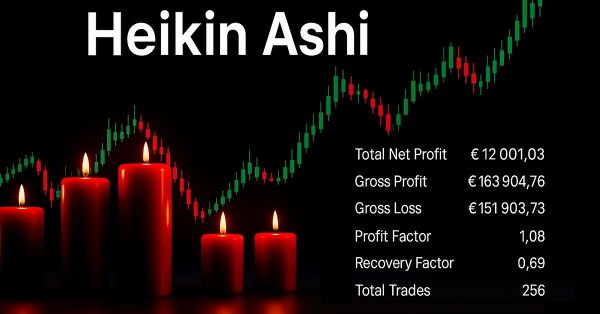
This article explains how to develop a professional Heikin Ashi-based Expert Advisor (EA) in MQL5. You will learn how to set up input parameters, enumerations, indicators, global variables, and implement the core trading logic. You will also be able to run a backtest on gold to validate your work.
This article walks the reader through a reimagined version of the classical Bollinger Band breakout strategy. It identifies key weaknesses in the original approach, such as its well-known susceptibility to false breakouts. The article aims to introduce a possible solution: the Double Bollinger Band trading strategy. This relatively lesser known approach supplements the weaknesses of the classical version and offers a more dynamic perspective on financial markets. It helps us overcome the old limitations defined by the original rules, providing traders with a stronger and more adaptive framework.
The strategy tester allows you to do more than just optimize your trading robot's parameters. I will show how to evaluate your account's trading history post-factum and make adjustments to your trading in the tester by changing the stop-losses of your open positions.
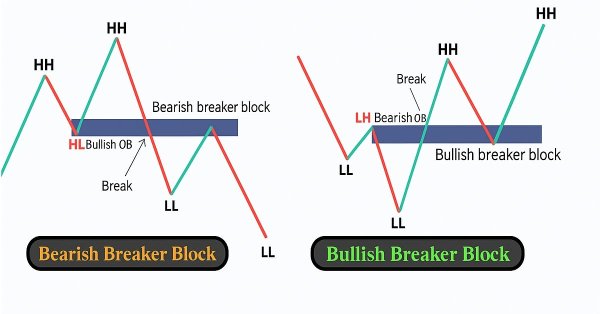
In this article, we create a Breaker Block Trading System in MQL5 that identifies consolidation ranges, detects breakouts, and validates breaker blocks with swing points to trade retests with defined risk parameters. The system visualizes order and breaker blocks with dynamic labels and arrows, supporting automated trading and trailing stops.
Using a ready-made solution in trading without concerning yourself with the internal workings of the system may sound comforting, but this is not always the case for developers. Eventually, an upgrade, misperformance, or unexpected error will arise, and it becomes essential to trace exactly where the issue originates to diagnose and resolve it quickly. Today’s discussion focuses on uncovering what normally happens behind the scenes of a trading Expert Advisor, and on developing a custom dedicated class for displaying and logging backend processes using MQL5. This gives both developers and traders the ability to quickly locate errors, monitor behavior, and access diagnostic information specific to each EA.
In this article, we develop an MQL5 First Run User Setup Wizard for Expert Advisors, featuring a scrollable guide with an interactive dashboard, dynamic text formatting, and visual controls like buttons and a checkbox allowing users to navigate instructions and configure trading parameters efficiently. Users of the program get to have insight of what the program is all about and what to do on the first run, more like an orientation model.
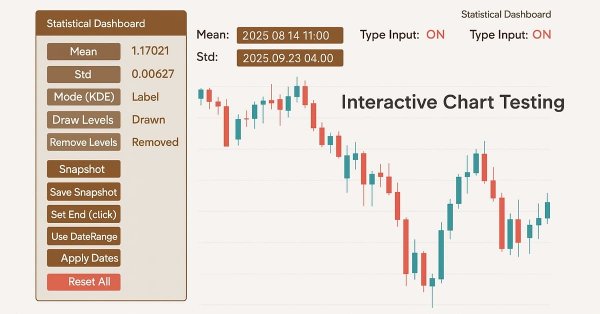
In a world where speed and precision matter, analysis tools need to be as smart as the markets we trade. This article presents an EA built on button logic—an interactive system that instantly transforms raw price data into meaningful statistical levels. With a single click, it calculates and displays mean, deviation, percentiles, and more, turning advanced analytics into clear on-chart signals. It highlights the zones where price is most likely to bounce, retrace, or break, making analysis both faster and more practical.
The article considers a new population optimization algorithm - Cyclic Parthenogenesis Algorithm (CPA), inspired by the unique reproductive strategy of aphids. The algorithm combines two reproduction mechanisms — parthenogenesis and sexual reproduction — and also utilizes the colonial structure of the population with the possibility of migration between colonies. The key features of the algorithm are adaptive switching between different reproductive strategies and a system of information exchange between colonies through the flight mechanism.
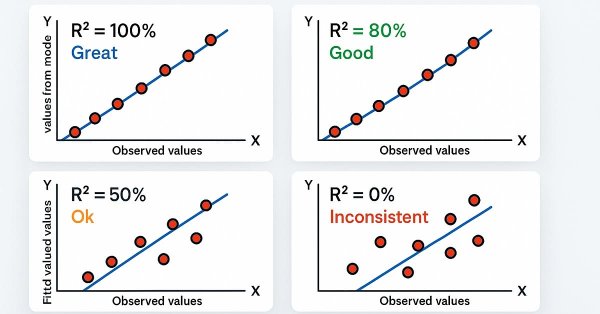
In this article, we develop a Trendline Breakout System in MQL5 that identifies support and resistance trendlines using swing points, validated by R-squared goodness of fit and angle constraints, to automate breakout trades. Our plan is to detect swing highs and lows within a specified lookback period, construct trendlines with a minimum number of touch points, and validate them using R-squared metrics and angle constraints to ensure reliability.
This article proposes an asset screening process for a statistical arbitrage trading strategy through cointegrated stocks. The system starts with the regular filtering by economic factors, like asset sector and industry, and finishes with a list of criteria for a scoring system. For each statistical test used in the screening, a respective Python class was developed: Pearson correlation, Engle-Granger cointegration, Johansen cointegration, and ADF/KPSS stationarity. These Python classes are provided along with a personal note from the author about the use of AI assistants for software development.
This article follows up ‘Part-74’, where we examined the pairing of Ichimoku and the ADX under a Supervised Learning framework, by moving our focus to Reinforcement Learning. Ichimoku and ADX form a complementary combination of support/resistance mapping and trend strength spotting. In this installment, we indulge in how the Twin Delayed Deep Deterministic Policy Gradient (TD3) algorithm can be used with this indicator set. As with earlier parts of the series, the implementation is carried out in a custom signal class designed for integration with the MQL5 Wizard, which facilitates seamless Expert Advisor assembly.
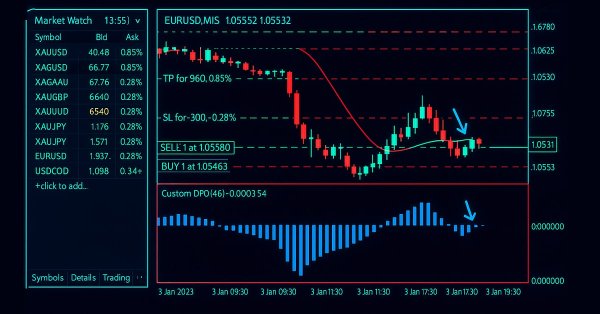
This article explains how to design and optimise a trading system using the Detrended Price Oscillator (DPO) in MQL5. It outlines the indicator's core logic, demonstrating how it identifies short-term cycles by filtering out long-term trends. Through a series of step-by-step examples and simple strategies, readers will learn how to code it, define entry and exit signals, and conduct backtesting. Finally, the article presents practical optimization methods to enhance performance and adapt the system to changing market conditions.
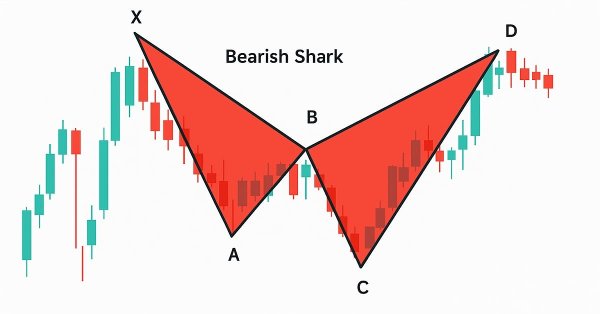
In this article, we develop a Shark pattern system in MQL5 that identifies bullish and bearish Shark harmonic patterns using pivot points and Fibonacci ratios, executing trades with customizable entry, stop-loss, and take-profit levels based on user-selected options. We enhance trader insight with visual feedback through chart objects like triangles, trendlines, and labels to clearly display the X-A-B-C-D pattern structure
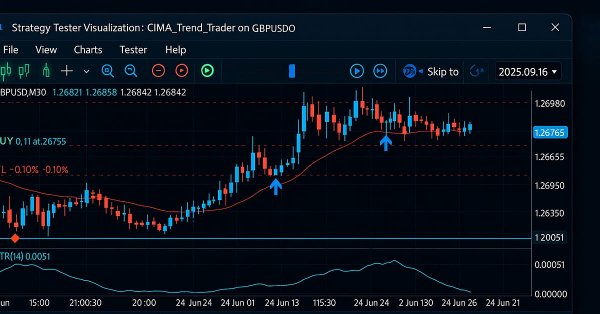
The MQL5 Standard Library plays a vital role in developing trading algorithms for MetaTrader 5. In this discussion series, our goal is to master its application to simplify the creation of efficient trading tools for MetaTrader 5. These tools include custom Expert Advisors, indicators, and other utilities. We begin today by developing a trend-following Expert Advisor using the CTrade, CiMA, and CiATR classes. This is an especially important topic for everyone—whether you are a beginner or an experienced developer. Join this discussion to discover more.
Let's explore how you can start integrating external code from any repository in the MQL5 Algo Forge storage into your own project. In this article, we finally turn to this promising, yet more complex, task: how to practically connect and use libraries from third-party repositories within MQL5 Algo Forge.
Machine learning is often viewed through statistical or linear algebraic lenses, but this article emphasizes a geometric perspective of model predictions. It demonstrates that models do not truly approximate the target but rather map it onto a new coordinate system, creating an inherent misalignment that results in irreducible error. The article proposes that multi-step predictions, comparing the model’s forecasts across different horizons, offer a more effective approach than direct comparisons with the target. By applying this method to a trading model, the article demonstrates significant improvements in profitability and accuracy without changing the underlying model.
In this article, we automate a custom market sentiment indicator that classifies market conditions into bullish, bearish, risk-on, risk-off, and neutral. The Expert Advisor delivers real-time insights into prevailing sentiment while streamlining the analysis process for current market trends or direction.
In this article, we develop a ChatGPT-integrated program in MQL5 with a user interface, leveraging the JSON parsing framework from Part 1 to send prompts to OpenAI’s API and display responses on a MetaTrader 5 chart. We implement a dashboard with an input field, submit button, and response display, handling API communication and text wrapping for user interaction.
This article introduces the ParaFrac Oscillator and its V2 model as trading tools. It outlines three trading strategies developed using these indicators. Each strategy was tested and optimized to identify their strengths and weaknesses. Comparative analysis highlighted the performance differences between the original and V2 models.
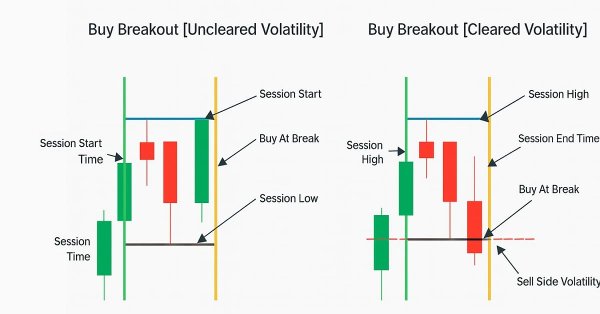
Volatility based breakout system identifies market ranges, then trades when price breaks above or below those levels, filtered by volatility measures such as ATR. This approach helps capture strong directional moves.
We explored the advanced use of #define for metaprogramming in MQL5, creating entities that represent tables and column metadata (type, primary key, auto-increment, nullability, etc.). We centralized these definitions in TickORM.mqh, automating the generation of metadata classes and paving the way for efficient data manipulation by the ORM, without having to write SQL manually.
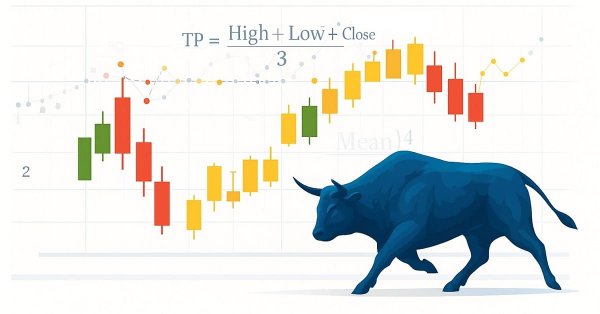
Statistics has always been at the heart of financial analysis. By definition, statistics is the discipline that collects, analyzes, interprets, and presents data in meaningful ways. Now imagine applying that same framework to candlesticks—compressing raw price action into measurable insights. How helpful would it be to know, for a specific period of time, the central tendency, spread, and distribution of market behavior? In this article, we introduce exactly that approach, showing how statistical methods can transform candlestick data into clear, actionable signals.
The article describes the experience of developing a hybrid trading system that combines classical technical analysis with neural networks. The author provides a detailed analysis of the system architecture from basic pattern analysis and neural network structure to the mechanisms behind trading decisions, and shares real code and practical observations.
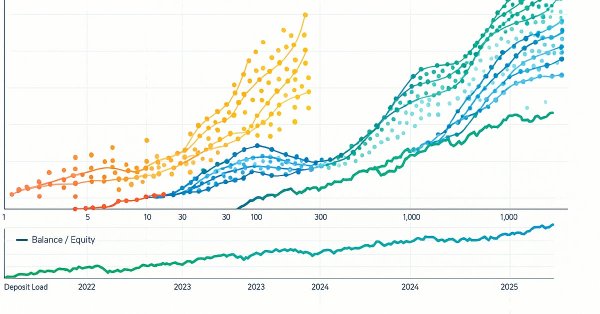
This article presents a study of the interaction of different activation functions with optimization algorithms in the context of neural network training. Particular attention is paid to the comparison of the classical ADAM and its population version when working with a wide range of activation functions, including the oscillating ACON and Snake functions. Using a minimalistic MLP (1-1-1) architecture and a single training example, the influence of activation functions on the optimization is isolated from other factors. The article proposes an approach to manage network weights through the boundaries of activation functions and a weight reflection mechanism, which allows avoiding problems with saturation and stagnation in training.
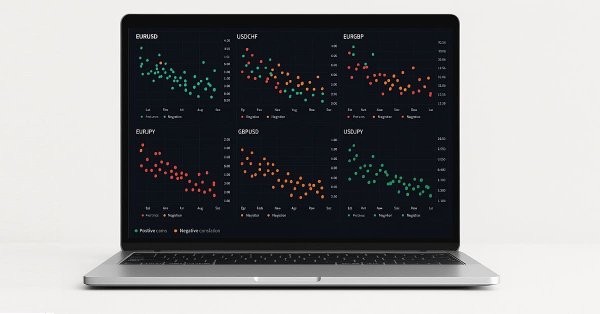
In this discussion, we will explore how the concept of Financial Correlation can be applied to improve decision-making efficiency when trading multiple symbols during major economic events announcement. The focus is on addressing the challenge of heightened risk exposure caused by increased volatility during news releases.
In this article, we develop a JSON parsing framework in MQL5 to handle data exchange for AI API integration, focusing on a JSON class for processing JSON structures. We implement methods to serialize and deserialize JSON data, supporting various data types like strings, numbers, and objects, essential for communicating with AI services like ChatGPT, enabling future AI-driven trading systems by ensuring accurate data handling and manipulation.
Learn how to detect and display the Gartley harmonic pattern in MetaTrader 5 using MQL5. This article explains each step of the process, from identifying swing points to applying Fibonacci ratios and plotting the full pattern on the chart for clear visual confirmation.
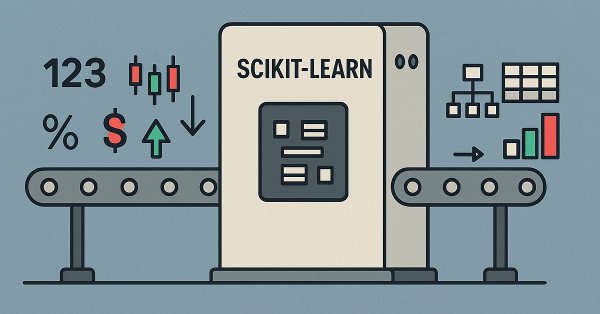
In this piece, we look at a key data preparation step for machine learning that is gaining rapid significance. Data Preprocessing Pipelines. These in essence are a streamlined sequence of data transformation steps that prepare raw data before it is fed to a model. As uninteresting as this may initially seem to the uninducted, this ‘data standardization’ not only saves on training time and execution costs, but it goes a long way in ensuring better generalization. In this article we are focusing on some SCIKIT-LEARN preprocessing functions, and while we are not exploiting the MQL5 Wizard, we will return to it in coming articles.
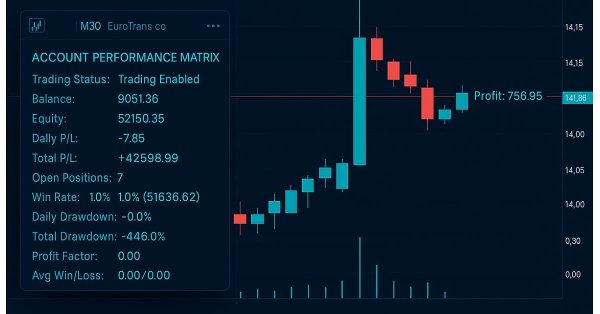
This indicator acts as a discipline enforcer by tracking account equity, profit/loss, and drawdown in real-time while displaying a performance dashboard. It can help traders stay consistent, avoid overtrading, and comply with prop-firm challenge rules.
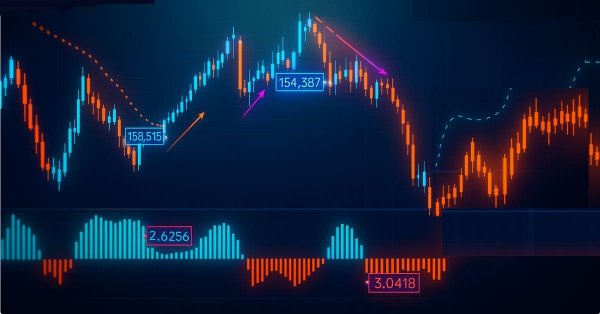
The Parafrac V2 Oscillator is an advanced technical analysis tool that integrates the Parabolic SAR with the Average True Range (ATR) to overcome limitations of its predecessor, which relied on fractals and was prone to signal spikes overshadowing previous and current signals. By leveraging ATR’s volatility measure, the version 2 offers a smoother, more reliable method for detecting trends, reversals, and divergences, helping traders reduce chart congestion and analysis paralysis.
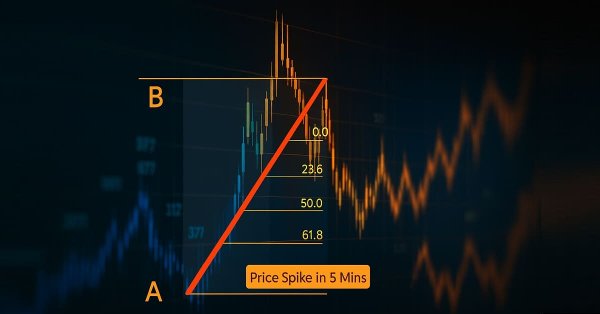
In financial markets, the laws of retracement remain among the most undeniable forces. It is a rule of thumb that price will always retrace—whether in large moves or even within the smallest tick patterns, which often appear as a zigzag. However, the retracement pattern itself is never fixed; it remains uncertain and subject to anticipation. This uncertainty explains why traders rely on multiple Fibonacci levels, each carrying a certain probability of influence. In this discussion, we introduce a refined strategy that applies Fibonacci techniques to address the challenges of trading shortly after major economic event announcements. By combining retracement principles with event-driven market behavior, we aim to uncover more reliable entry and exit opportunities. Join to explore the full discussion and see how Fibonacci can be adapted to post-event trading.