In this article, we will look at the theory of causal inference using machine learning, as well as the custom approach implementation in Python. Causal inference and causal thinking have their roots in philosophy and psychology and play an important role in our understanding of reality.
In this article, we will look at drawing arrow multi-symbol multi-period indicators. We will also improve the class methods for correct display of arrows showing data from arrow indicators calculated on a symbol/period that does not correspond to the symbol/period of the current chart.
This article explores how economic news releases, investor behavior, and various factors can influence market trend reversals. It includes a video explanation and proceeds by incorporating MQL5 code into our program to detect trend reversals, alert us, and take appropriate actions based on market conditions. This builds upon previous articles in the series.
Spurious regressions occur when two time series exhibit a high degree of correlation purely by chance, leading to misleading results in regression analysis. In such cases, even though variables may appear to be related, the correlation is coincidental and the model may be unreliable.
There are quite a lot of different trading strategies. So, it might be useful to apply several strategies working in parallel to diversify risks and increase the stability of trading results. But if each strategy is implemented as a separate Expert Advisor (EA), then managing their work on one trading account becomes much more difficult. To solve this problem, it would be reasonable to implement the operation of different trading strategies within a single EA.
Symbolic Regression is a form of regression that starts with minimal to no assumptions on what the underlying model that maps the sets of data under study would look like. Even though it can be implemented by Bayesian Methods or Neural Networks, we look at how an implementation with Genetic Algorithms can help customize an expert signal class usable in the MQL5 wizard.
In this article, we will look at the binary genetic algorithm (BGA), which models the natural processes that occur in the genetic material of living things in nature.
A step-by-step guide to creating and implementing an automated trading algorithm in MQL5 based on the Fair Value Gap (FVG) trading strategy. A detailed tutorial on creating an expert advisor that can be useful for both beginners and experienced traders.
This article simplifies triangular arbitrage, showing you how to use predictions and specialized software to trade currencies smarter, even if you're new to the market. Ready to trade with expertise?
In offline learning, we use a fixed dataset, which limits the coverage of environmental diversity. During the learning process, our Agent can generate actions beyond this dataset. If there is no feedback from the environment, how can we be sure that the assessments of such actions are correct? Maintaining the Agent's policy within the training dataset becomes an important aspect to ensure the reliability of training. This is what we will talk about in this article.
This article discusses the implementation of automatic moves in the tic-tac-toe game in Python, integrated with MQL5 functions and unit tests. The goal is to improve the interactivity of the game and ensure the reliability of the system through testing in MQL5. The presentation covers game logic development, integration, and hands-on testing, and concludes with the creation of a dynamic game environment and a robust integrated system.
In this article, we will explore various methods used in binary genetic and other population algorithms. We will look at the main components of the algorithm, such as selection, crossover and mutation, and their impact on the optimization. In addition, we will study data presentation methods and their impact on optimization results.
Bayesian inference is the adoption of Bayes Theorem to update probability hypothesis as new information is made available. This intuitively leans to adaptation in time series analysis, and so we have a look at how we could use this in building custom classes not just for the signal but also money-management and trailing-stops.
We will walk around statistical arbitrage, we will search with python for correlation and cointegration symbols, we will make an indicator for Pearson's coefficient and we will make an EA for trading statistical arbitrage with predictions done with python and ONNX models.
In this article we present the implementation of a feature selection algorithm described in an academic paper titled,"FREL: A stable feature selection algorithm", called Feature weighting as regularized energy based learning.
This article focuses on taking advantage of in-built meta trader 5 indicators to screen out off-trend signals. Advancing from the previous article we will explore how to do it using MQL5 code to communicate our idea to the final program.
Discover the ultimate beginner's guide to building Expert Advisors (EAs) with MQL5 in our comprehensive article. Learn step-by-step how to construct EAs using pseudocode and harness the power of AI-generated code. Whether you're new to algorithmic trading or seeking to enhance your skills, this guide provides a clear path to creating effective EAs.
Neural Architecture Search, an automated approach at determining the ideal neural network settings can be a plus when facing many options and large test data sets. We examine how when paired Eigen Vectors this process can be made even more efficient.
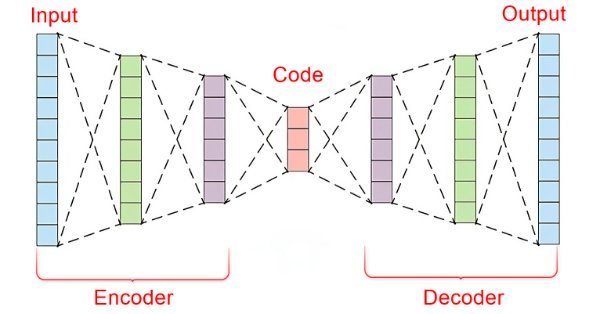
In the fast-paced world of financial markets, separating meaningful signals from the noise is crucial for successful trading. By employing sophisticated neural network architectures, autoencoders excel at uncovering hidden patterns within market data, transforming noisy input into actionable insights. In this article, we explore how autoencoders are revolutionizing trading practices, offering traders a powerful tool to enhance decision-making and gain a competitive edge in today's dynamic markets.
Many people who consider themselves MQL5 programmers do not have the basic knowledge that I will outline in this article. Many people consider MQL5 to be a limited tool, but the actual reason is that they do not have the required knowledge. So, if you don't know something, don't be ashamed of it. It's better to feel ashamed for not asking. Simply forcing MetaTrader 5 to disable indicator duplication in no way ensures two-way communication between the indicator and the Expert Advisor. We are still very far from this, but the fact that the indicator is not duplicated on the chart gives us some confidence.
Learn how to create custom indicators using MQL5. This introductory article will guide you through the fundamentals of building simple custom indicators and demonstrate a hands-on approach to coding different custom indicators for any MQL5 programmer new to this interesting topic.
In this article we will talk about how MQL5 can interact with Python and FastAPI, using HTTP calls in MQL5 to interact with the tic-tac-toe game in Python. The article discusses the creation of an API using FastAPI for this integration and provides a test script in MQL5, highlighting the versatility of MQL5, the simplicity of Python, and the effectiveness of FastAPI in connecting different technologies to create innovative solutions.
Trading across multiple currencies is not available by default when an expert advisor is assembled via the wizard. We examine 2 possible hacks traders can make when looking to test their ideas off more than one symbol at a time.
In this article we continue our exploration of the Group Method of Data Handling family of algorithms, with the implementation of the Combinatorial Algorithm along with its refined incarnation, the Combinatorial Selective Algorithm in MQL5.
In this article, we will finally begin to do what we wanted to do much earlier. However, due to the lack of "solid ground", I did not feel confident to present this part publicly. Now I have the basis to do this. I suggest that you focus as much as possible on understanding the content of this article. I mean not simply reading it. I want to emphasize that if you do not understand this article, you can completely give up hope of understanding the content of the following ones.
Since the first articles devoted to reinforcement learning, we have in one way or another touched upon 2 problems: exploring the environment and determining the reward function. Recent articles have been devoted to the problem of exploration in offline learning. In this article, I would like to introduce you to an algorithm whose authors completely eliminated the reward function.
One of the things that can make our lives as programmers difficult is assumptions. In this article, I will show you how dangerous it is to make assumptions: both in MQL5 programming, where you assume that the type will have a certain value, and in MetaTrader 5, where you assume that different servers work the same.
In this article, we will provide another volatility-based indicator named Chaikin Volatility. We will understand how to build a custom indicator after identifying how it can be used and constructed. We will share some simple strategies that can be used and then test them to understand which one can be better.
The article considers an optimization method based on the principles of the body's immune system - Micro Artificial Immune System (Micro-AIS) - a modification of AIS. Micro-AIS uses a simpler model of the immune system and simple immune information processing operations. The article also discusses the advantages and disadvantages of Micro-AIS compared to conventional AIS.
Before we can move forward, we need to fix a few things. These are not actually the necessary fixes but rather improvements to the way the class is managed and used. The reason is that failures occurred due to some interaction within the system. Despite attempts to find out the cause of such failures in order to eliminate them, all these attempts were unsuccessful. Some of these cases make no sense, for example, when we use pointers or recursion in C/C++, the program crashes.
This article is aimed at beginners and pro-MQL5 developers. It provides a piece of code to define and constrain signal-generating indicators to trends in higher timeframes. In this way, traders can enhance their strategies by incorporating a broader market perspective, leading to potentially more robust and reliable trading signals.
In this article we will present a way to implement optimization problems with multiple objectives and constraints when selecting "Custom Max" in the Setting tab of the MetaTrader 5 terminal. As an example, the optimization problem could be: Maximize Profit Factor, Net Profit, and Recovery Factor, such that the Draw Down is less than 10%, the number of consecutive losses is less than 5, and the number of trades per week is more than 5.
The article presents a new approach to solving optimization problems by combining ideas from bacterial foraging optimization (BFO) algorithms and techniques used in the genetic algorithm (GA) into a hybrid BFO-GA algorithm. It uses bacterial swarming to globally search for an optimal solution and genetic operators to refine local optima. Unlike the original BFO, bacteria can now mutate and inherit genes.
In this article, we will complete the first phase of construction. Although this part is fairly quick to complete, I will cover details that were not discussed previously. I will explain some points that many do not understand. Do you know why you have to press the Shift or Ctrl key?
In this article we will talk about the importance of APIs (Application Programming Interface) for interaction between different applications and software systems. We will see the role of APIs in simplifying interactions between applications, allowing them to efficiently share data and functionality.
The article considers a group of optimization algorithms known as Evolution Strategies (ES). They are among the very first population algorithms to use evolutionary principles for finding optimal solutions. We will implement changes to the conventional ES variants and revise the test function and test stand methodology for the algorithms.
ONNX is a great tool for integrating complex AI code between different platforms, it is a great tool that comes with some challenges that one must address to get the most out of it, In this article we discuss the common issues you might face and how to mitigate them.
Today we will continue to develop the order system. As you will see, we will be massively reusing what has already been shown in other articles. Nevertheless, you will receive a small reward in this article. First, we will develop a system that can be used with a real trading server, both from a demo account or from a real one. We will make extensive use of the MetaTrader 5 platform, which will provide us with all the necessary support from the beginning.
In this article, I will consider the option of obtaining information about closed positions based on their trading history. Besides, I will create a simple indicator that displays the approximate profit/loss of positions on each bar as a diagram.