Any Program in any programming language has a specific structure. In this article, you will learn essential parts of the MQL5 program structure by understanding the programming basics of every part of the MQL5 program structure that can be very helpful when creating our MQL5 trading system or trading tool that can be executable in the MetaTrader 5.
This article on Category Theory implementation in MQL5, continues the series by looking at Functors but this time as a bridge between Graphs and a set. We revisit calendar data, and despite its limitations in Strategy Tester use, make the case using functors in forecasting volatility with the help of correlation.
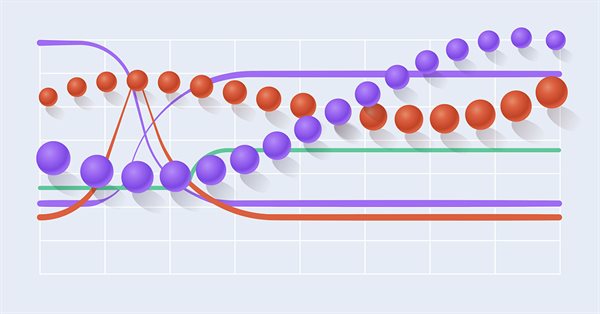
This article which is part of a broader series on Category Theory implementation in MQL5, delves into Functors. We examine how a Linear Order can be mapped to a set, thanks to Functors; by considering two sets of data that one would typically dismiss as having any connection.
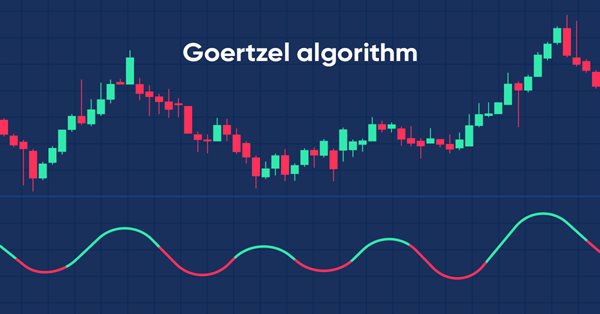
In this article we present code utilities that implement the goertzel algorithm in Mql5 and explore two ways in which the technique can be used in the analysis of price quotes for possible strategy development.
Functions are critical things in any programming language, it helps developers apply the concept of (DRY) which means do not repeat yourself, and many other benefits. In this article, you will find much more information about functions and how we can create our own functions in MQL5 with simple applications that can be used or called in any system you have to enrich your trading system without complicating things.
This article, that follows Category Theory implementation of Orders in MQL5, considers how database schemas can be incorporated for classification in MQL5. We take an introductory look at how database schema concepts could be married with category theory when identifying trade relevant text(string) information. Calendar events are the focus.
How about creating a system that would allow us to study the market when it is closed or even to simulate market situations? Here we are going to start a new series of articles in which we will deal with this topic.
Old trading strategies. This article presents one of the strategies used to follow the trend in a purely technical way. The strategy is purely technical and uses a few technical indicators and tools to deliver signals and targets. The components of the strategy are as follows: A 14-period stochastic oscillator. A 5-period stochastic oscillator. A 200-period moving average. A Fibonacci projection tool (for target setting).
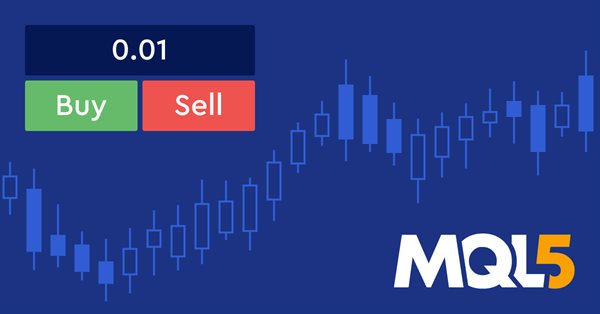
In this article, we will provide a simple and easy guide to anyone who needs to create one of the most valuable and helpful tools in trading which is the graphical panel to simplify and ease doing tasks around trading which helps to save time and focus more on your trading process itself without any distractions.
This article will be a kind of interview with myself, in which I will tell you how I took my first steps in the MQL5 language. I will show you how you can become a great MQL5 programmer. I will explain the necessary bases for you to achieve this feat. The only prerequisite is a willingness to learn.
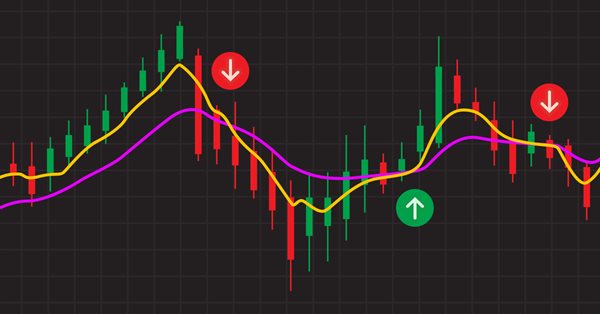
Combinations of strategies may offer better opportunities. We can combine indicators or patterns together, or even better, indicators with patterns, so that we get an extra confirmation factor. Moving averages help us confirm and ride the trend. They are the most known technical indicators and this is because of their simplicity and their proven track record of adding value to analyses.
Unlock the potential of dynamic data representation in your trading strategies and utilities with our in-depth guide to creating movable GUIs in MQL5. Delve into the fundamental principles of object-oriented programming and discover how to design and implement single or multiple movable GUIs on the same chart with ease and efficiency.
This article reports the first attempts in the development of a native MQTT client for MQL5. MQTT is a Client Server publish/subscribe messaging transport protocol. It is lightweight, open, simple, and designed to be easy to implement. These characteristics make it ideal for use in many situations.
This material provides a complete guide to creating a class in MQL5 for efficient management of CSV files. We will see the implementation of methods for opening, writing, reading, and transforming data. We will also consider how to use them to store and access information. In addition, we will discuss the limitations and the most important aspects of using such a class. This article ca be a valuable resource for those who want to learn how to process CSV files in MQL5.
This article which is part of a series that follows Category Theory implementation of Graphs in MQL5, delves in Orders. We examine how concepts of Order-Theory can support monoid sets in informing trade decisions by considering two major ordering types.
In this article, we will create a mathematical model for simulating multicurrency pricing and complete the study of the diversification principle as part of the search for mechanisms to increase the trading efficiency, which I started in the previous article with theoretical calculations.
As developers, we need to learn how to create and develop software that can be reusable and flexible without duplicated code especially if we have different objects with different behaviors. This can be smoothly done by using object-oriented programming techniques and principles. In this article, we will present the basics of MQL5 Object-Oriented programming to understand how we can use principles and practices of this critical topic in our software.
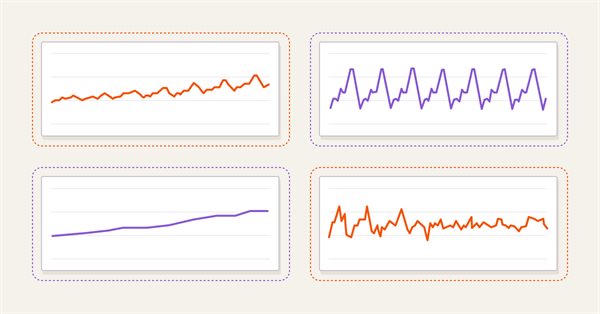
Mean reversion is a type of contrarian trading where the trader expects the price to return to some form of equilibrium which is generally measured by a mean or another central tendency statistic.
This article is a continuation in a series that look at Category Theory implementation in MQL5. In here we examine how Graph-Theory could be integrated with monoids and other data structures when developing a close-out strategy to a trading system.
To complete this series of articles on automation, we will continue discussing the topic of the previous article. We will see how everything will fit together, making the EA run like clockwork.
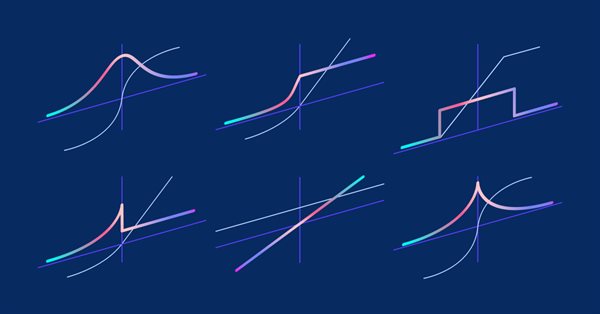
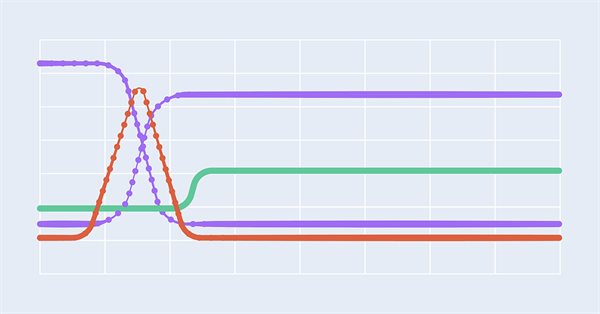
Here we will describe only one of the aspects of machine learning - activation functions. In artificial neural networks, a neuron activation function calculates an output signal value based on the values of an input signal or a set of input signals. We will delve into the inner workings of the process.
This article continues the series on category theory implementation in MQL5. Here we look at monoid-groups as a means normalising monoid sets making them more comparable across a wider span of monoid sets and data types..
In this article, we will put into practice all the knowledge from this series. We will finally build a 100% automated and functional system. But before that, we still have to learn one last detail.
My main goal in this article is to provide you with a simple and accurate account of the steps that will help you become a top signal provider on MQL5.com. Drawing upon my knowledge and experience, I will explain what it takes to become a successful signal provider, including how to find, test, and optimize a good strategy. Additionally, I will provide tips on publishing your signal, writing a compelling description and effectively promoting and managing it.
The multilayer perceptron is an evolution of the simple perceptron which can solve non-linear separable problems. Together with the backpropagation algorithm, this neural network can be effectively trained. In Part 3 of the Multilayer Perceptron and Backpropagation series, we'll see how to integrate this technique into the Strategy Tester. This integration will allow the use of complex data analysis aimed at making better decisions to optimize your trading strategies. In this article, we will discuss the advantages and problems of this technique.
Unleash the power of dynamic data representation in your trading strategies or utilities with our comprehensive guide on creating movable GUI in MQL5. Dive into the core concept of chart events and learn how to design and implement simple and multiple movable GUI on the same chart. This article also explores the process of adding elements to your GUI, enhancing their functionality and aesthetic appeal.
The article considers the grid trading approach based on stop pending orders and implemented in an MQL5 Expert Advisor on the Moscow Exchange (MOEX). When trading in the market, one of the simplest strategies is a grid of orders designed to "catch" the market price.
Do you know what a flowchart is? Can you use it? Do you think flowcharts are for beginners? I suggest that we proceed to this new article and learn how to work with flowcharts.
In this article, we will use the rebuy algorithm for a deeper understanding of the efficiency of trading systems and start working on the general principles of improving trading efficiency using mathematics and logic, as well as apply the most non-standard methods of increasing efficiency in terms of using absolutely any trading system.
This article continues the series on category theory implementation in MQL5. Here we continue monoid-actions as a means of transforming monoids, covered in the previous article, leading to increased applications.
We will look at several new ways of building money management systems and define their main features. Today, there are quite a few money management strategies to fit every taste. We will try to consider several ways to manage money based on different mathematical growth models.
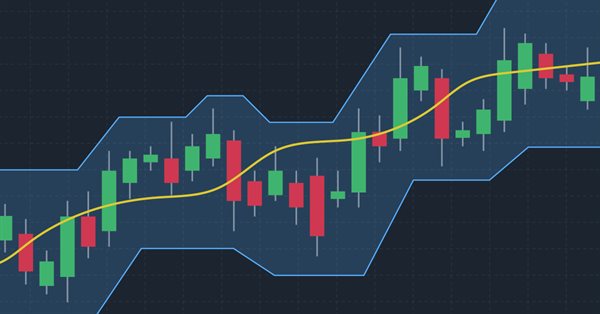
There are many technical tools that can be used to visualize a channel surrounding prices, One of these tools is the Donchian Channel indicator. In this article, we will learn how to create the Donchian Channel indicator and how we can trade it as a custom indicator using EA.
The article provides an example of using a perceptron as a self-sufficient price prediction tool by showcasing general concepts and the simplest ready-made Expert Advisor followed by the results of its optimization.
In this article we discuss methods related to the analysis of timeseries in the frequency domain. Emphasizing the utility of examining the power spectra of time series when building predictive models. In this article we will discuss some of the useful perspectives to be gained by analyzing time series in the frequency domain using the discrete fourier transform (dft).
This article continues the series on category theory implementation in MQL5. Here we introduce monoids as domain (set) that sets category theory apart from other data classification methods by including rules and an identity element.