We consider XLY, SPDR’s consumer discretionary spending ETF and see if with tools in MetaTrader’s IDE we can sift through an array of data sets in selecting what could work with a forecasting model with a forward outlook of not more than a year.
In this article we will complete the development of a simulator for our system. The main goal here will be to configure the algorithm discussed in the previous article. This algorithm aims to create a RANDOM WALK movement. Therefore, to understand today's material, it is necessary to understand the content of previous articles. If you have not followed the development of the simulator, I advise you to read this sequence from the very beginning. Otherwise, you may get confused about what will be explained here.
The article considers handling trade request structures, namely creating a request, its preliminary verification before sending it to the server, the server's response to a trade request and the structure of trade transactions. We will create simple and convenient functions for sending trading orders to the server and, based on everything discussed, create an EA informing of trade transactions.
In this article we will continue the simulator development stage. this time we will see how to effectively create a RANDOM WALK type movement. This type of movement is very intriguing because it forms the basis of everything that happens in the capital market. In addition, we will begin to understand some concepts that are fundamental to those conducting market analysis.
The Multi-Currency Expert Advisor in this article is Expert Advisor or trading robot that can trade (open orders, close orders and manage orders for example: Trailing Stop Loss and Trailing Profit) for more than one symbol pair only from one symbol chart. This time we will use only 1 indicator, namely Triangular moving average in multi-timeframes or single timeframe.
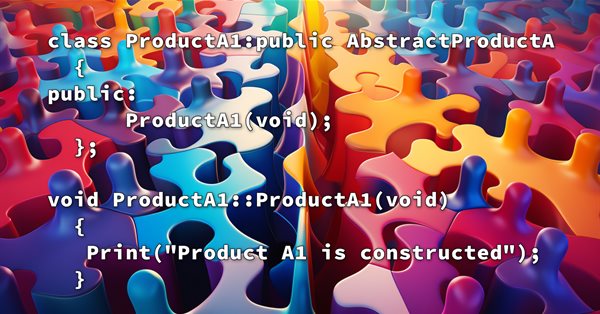
In this article, we will continue our articles about Design Patterns after learning how much this topic is more important for us as developers to develop extendable, reliable applications not only by the MQL5 programming language but others as well. We will learn about another type of Design Patterns which is the structural one to learn how to design systems by using what we have as classes to form larger structures.
In this article, we will see how to develop a quality score that your Expert Advisor can display in the strategy tester. We will look at two well-known calculation methods – Van Tharp and Sunny Harris.
In this article we present the implementation of Combinatorially Symmetric Cross Validation in pure MQL5, to measure the degree to which a overfitting may occure after optimizing a strategy using the slow complete algorithm of the Strategy Tester.
Here we will simplify a few elements related to the work in the next article. I'll also explain how you can visualize what the simulator generates in terms of randomness.
The last two articles considered the Soft Actor-Critic algorithm, which incorporates entropy regularization into the reward function. This approach balances environmental exploration and model exploitation, but it is only applicable to stochastic models. The current article proposes an alternative approach that is applicable to both stochastic and deterministic models.
In the previous article, we implemented the Soft Actor-Critic algorithm, but were unable to train a profitable model. Here we will optimize the previously created model to obtain the desired results.
XLV is SPDR healthcare ETF and in an age where it is common to be bombarded by a wide array of traditional news items plus social media feeds, it can be pressing to select a data set for use with a model. We try to tackle this problem for this ETF by sizing up some of its critical data sets in MQL5.
In this article, I will show a completely different approach to algorithmic trading I ended up with after quite a long time. Of course, all this has to do with my brute force program, which has undergone a number of changes that allow it to solve several problems simultaneously. Nevertheless, the article has turned out to be more general and as simple as possible, which is why it is also suitable for those who know nothing about brute force.
Within the framework of the engineering approach developed by the author based on the probability theory, the conditions for opening a profitable position are found and the optimal (profit-maximizing) take profit and stop loss values are calculated.
Discover the indispensable role of Support Vector Machines (SVM) in shaping the future of trading. This comprehensive guide explores how SVM can elevate your trading strategies, enhance decision-making, and unlock new opportunities in the financial markets. Dive into the world of SVM with real-world applications, step-by-step tutorials, and expert insights. Equip yourself with the essential tool that can help you navigate the complexities of modern trading. Elevate your trading game with SVM—a must-have for every trader's toolbox.
Developing a simulator can be much more interesting than it seems. Today we'll take a few more steps in this direction because things are getting more interesting.
In order to use the data that forms the bars, we must abandon replay and start developing a simulator. We will use 1 minute bars because they offer the least amount of difficulty.
Several fellow traders sent emails or commented about how to use this Multi-Currency EA on brokers with symbol names that have prefixes and/or suffixes, and also how to implement trading time zones or trading time sessions on this Multi-Currency EA.
There are methods that can be used to solve many problems that can be repeated. Once understand how to use these methods it can be very helpful to create your software effectively and apply the concept of DRY ((Do not Repeat Yourself). In this context, the topic of Design Patterns will serve very well because they are patterns that provide solutions to well-described and repeated problems.
In this article, we will explore the application of regression models from the Scikit-learn package, attempt to convert them into ONNX format, and use the resultant models within MQL5 programs. Additionally, we will compare the accuracy of the original models with their ONNX versions for both float and double precision. Furthermore, we will examine the ONNX representation of regression models, aiming to provide a better understanding of their internal structure and operational principles.
We continue our discussion of reinforcement learning algorithms for solving continuous action space problems. In this article, I will present the Soft Actor-Critic (SAC) algorithm. The main advantage of SAC is the ability to find optimal policies that not only maximize the expected reward, but also have maximum entropy (diversity) of actions.
In the previous article, we introduced the DDPG method, which allows training models in a continuous action space. However, like other Q-learning methods, DDPG is prone to overestimating Q-function values. This problem often results in training an agent with a suboptimal strategy. In this article, we will look at some approaches to overcome the mentioned issue.
In this article, we expand the range of tasks of our agent. The training process will include some aspects of money and risk management, which are an integral part of any trading strategy.
This article is the fourth part of a series describing our development steps of a native MQL5 client for the MQTT protocol. In this part, we describe what MQTT v5.0 Properties are, their semantics, how we are reading some of them, and provide a brief example of how Properties can be used to extend the protocol.
Data classification for purposes of analysis and forecasting is a very diverse arena within machine learning and it features a large number of approaches and methods. This piece looks at one such approach, namely Agglomerative Hierarchical Classification.
In this article, we will have a look at yet another reinforcement learning approach. It is called goal-conditioned reinforcement learning (GCRL). In this approach, an agent is trained to achieve different goals in specific scenarios.
Training useful skills without an explicit reward function is one of the main challenges in hierarchical reinforcement learning. Previously, we already got acquainted with two algorithms for solving this problem. But the question of the completeness of environmental research remains open. This article demonstrates a different approach to skill training, the use of which directly depends on the current state of the system.
In the previous article, we introduced the DIAYN method, which offers the algorithm for learning a variety of skills. The acquired skills can be used for various tasks. But such skills can be quite unpredictable, which can make them difficult to use. In this article, we will look at an algorithm for learning predictable skills.
The problem of reinforcement learning lies in the need to define a reward function. It can be complex or difficult to formalize. To address this problem, activity-based and environment-based approaches are being explored to learn skills without an explicit reward function.
In the context of reinforcement learning, model procrastination can be caused by several reasons. The article considers some of the possible causes of model procrastination and methods for overcoming them.
In this article we present an algorithm for permuting price bars and detail how permutation tests can be used to recognize instances where strategy performance has been fabricated to deceive potential buyers of Expert Advisors.
With the rapid development of artificial intelligence today, language models (LLMs) are an important part of artificial intelligence, so we should think about how to integrate powerful LLMs into our algorithmic trading. For most people, it is difficult to fine-tune these powerful models according to their needs, deploy them locally, and then apply them to algorithmic trading. This series of articles will take a step-by-step approach to achieve this goal.
The article describes hierarchical training models that offer an effective approach to solving complex machine learning problems. Hierarchical models consist of several levels, each of which is responsible for different aspects of the task.
This article discusses the use of the Go-Explore algorithm over a long training period, since the random action selection strategy may not lead to a profitable pass as training time increases.
In this article we will look at the MqlDateTime, MqlTick, MqlRates and MqlBookInfo strutures, as well as methods for printing data from them. In order to print all the fields of a structure, there is a standard ArrayPrint() function, which displays the data contained in the array with the type of the handled structure in a convenient tabular format.
In this article, we will consider one of the methods of spectral analysis and signal processing - the discrete Hartley transform. It allows filtering signals, analyzing their spectrum and much more. The capabilities of DHT are no less than those of the discrete Fourier transform. However, unlike DFT, DHT uses only real numbers, which makes it more convenient for implementation in practice, and the results of its application are more visual.
With the rapid development of artificial intelligence today, language models (LLMs) are an important part of artificial intelligence, so we should think about how to integrate powerful LLMs into our algorithmic trading. For most people, it is difficult to fine-tune these powerful models according to their needs, deploy them locally, and then apply them to algorithmic trading. This series of articles will take a step-by-step approach to achieve this goal.
A new article about a new important topic which is dealing with date and time. As traders or programmers of trading tools, it is very crucial to understand how to deal with these two aspects date and time very well and effectively. So, I will share some important information about how we can deal with date and time to create effective trading tools smoothly and simply without any complicity as much as I can.