In this article, we will look at how to improve and more effectively apply the concepts presented in the previous article using the powerful MQL5 graphical control libraries. We'll go step by step through the process of creating a fully functional GUI. I'll be explaining the ideas behind it, as well as the purpose and operation of each method used. Additionally, at the end of the article, we will test the panel we created to ensure it functions correctly and meets its stated goals.
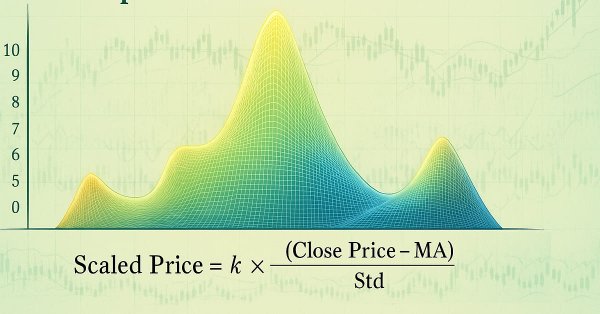
Generating new indicators from existing ones offers a powerful way to enhance trading analysis. By defining a mathematical function that integrates the outputs of existing indicators, traders can create hybrid indicators that consolidate multiple signals into a single, efficient tool. This article introduces a new indicator built from three oscillators using a modified version of the Pearson correlation function, which we call the Pseudo Pearson Correlation (PPC). The PPC indicator aims to quantify the dynamic relationship between oscillators and apply it within a practical trading strategy.
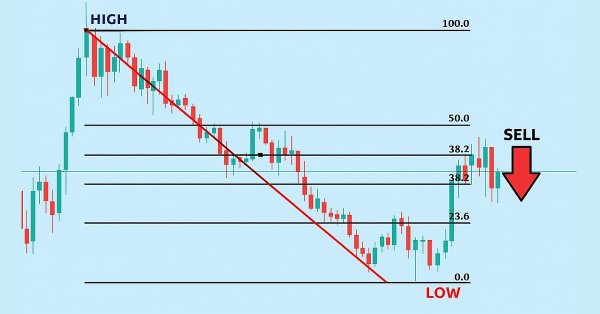
In this article, we build an MQL5 Expert Advisor for Fibonacci retracement trading, using either daily candle ranges or lookback arrays to calculate custom levels like 50% and 61.8% for entries, determining bullish or bearish setups based on close vs. open. The system triggers buys or sells on price crossings of levels with max trades per level, optional closure on new Fib calcs, points-based trailing stops after a min profit threshold, and SL/TP buffers as percentages of the range.
In this part, we focus on how to merge real-time market feedback—such as live trade outcomes, volatility changes, and liquidity shifts—with adaptive model learning to maintain a responsive and self-improving trading system.
This article introduces the Triple Sine Mean Reversion Method, a trading strategy built upon a new mathematical indicator — the Triple Sine Oscillator (TSO). The TSO is derived from the sine cube function, which oscillates between –1 and +1, making it suitable for identifying overbought and oversold market conditions. Overall, the study demonstrates how mathematical functions can be transformed into practical trading tools.
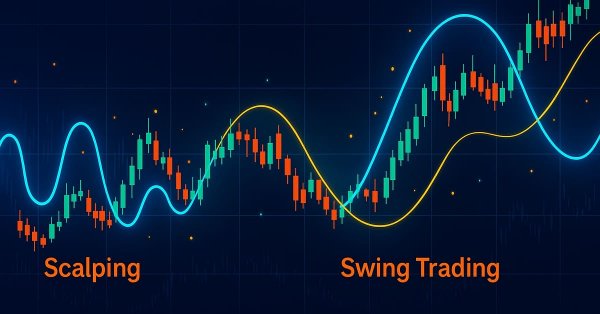
This part explores how to design a Dynamic Multi-Pair Expert Advisor capable of adapting between Scalping and Swing Trading modes. It covers the structural and algorithmic differences in signal generation, trade execution, and risk management, allowing the EA to intelligently switch strategies based on market behavior and user input.
Learn how to build a clean and professional on-chart control panel in MQL5 for a Risk-Based Trade Placement Expert Advisor. This step-by-step guide explains how to design a functional GUI that allows traders to input trade parameters, calculate lot size, and prepare for automated order placement.
In this article, we demonstrated how the fascinating mathematical concept of the Butterfly Curve can be transformed into a practical trading tool. We constructed the Butterfly Oscillator and built a foundational trading strategy around it. The strategy effectively combines the oscillator's unique cyclical signals with traditional trend confirmation from moving averages, creating a systematic approach for identifying potential market entries.
This is a high-timeframe-based EA that makes long-term analyses, trading decisions, and executions based on higher-timeframe analyses of W1, D1, and MN. This article will explore in detail an EA that is specifically designed for long-term traders who are patient enough to withstand and hold their positions during tumultuous lower time frame price action without changing their bias frequently until take-profit targets are hit.
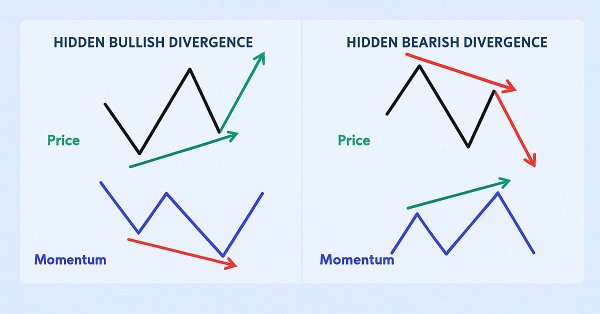
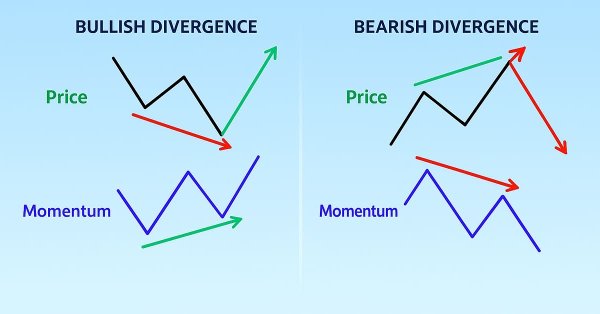
In this article, we build an MQL5 EA that detects hidden RSI divergences via swing points with strength, bar ranges, tolerance, and slope angle filters for price and RSI lines. It executes buy/sell trades on validated signals with fixed lots, SL/TP in pips, and optional trailing stops for risk control.
Sequential bootstrapping reshapes bootstrap sampling for financial machine learning by actively avoiding temporally overlapping labels, producing more independent training samples, sharper uncertainty estimates, and more robust trading models. This practical guide explains the intuition, shows the algorithm step‑by‑step, provides optimized code patterns for large datasets, and demonstrates measurable performance gains through simulations and real backtests.
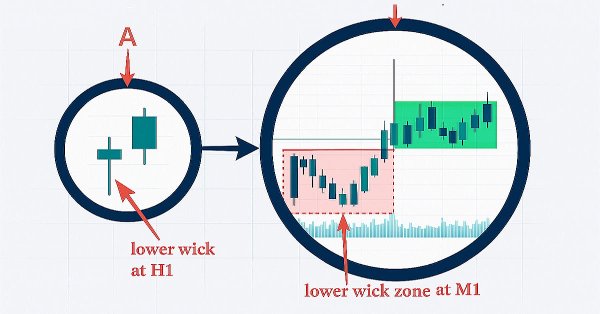
In this discussion, we take a step forward to uncover the underlying price action hidden within candlestick wicks. By integrating a wick visualization feature into the Market Periods Synchronizer, we enhance the tool with greater analytical depth and interactivity. This upgraded system allows traders to visualize higher-timeframe price rejections directly on lower-timeframe charts, revealing detailed structures that were once concealed within the shadows.
This article introduces how to use the WebRequest() function and APIs in MQL5 to communicate with external platforms. You’ll learn how to create a Telegram bot, obtain chat and group IDs, and send, edit, and delete messages directly from MT5, building a strong foundation for mastering API integration in your future MQL5 projects.
Discover how to fix a critical flaw in financial machine learning that causes overfit models and poor live performance—label concurrency. When using the triple-barrier method, your training labels overlap in time, violating the core IID assumption of most ML algorithms. This article provides a hands-on solution through sample weighting. You will learn how to quantify temporal overlap between trading signals, calculate sample weights that reflect each observation's unique information, and implement these weights in scikit-learn to build more robust classifiers. Learning these essential techniques will make your trading models more robust, reliable and profitable.
In this article, we build an MQL5 EA that detects regular RSI divergences using swing points with strength, bar limits, and tolerance checks. It executes trades on bullish or bearish signals with fixed lots, SL/TP in pips, and optional trailing stops. Visuals include colored lines on charts and labeled swings for better strategy insights.
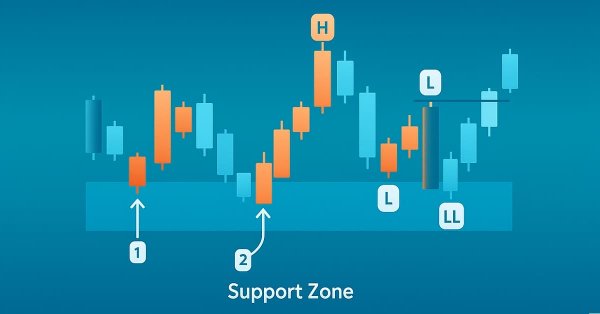
This article teaches you how to build an MQL5 Expert Advisor that automatically detects support and resistance zones and executes trades based on them. You’ll learn how to program your EA to identify these key market levels, monitor price reactions, and make trading decisions without manual intervention.
The UT BOT ATR Trailing Indicator is a personal and customizable indicator that is very effective for traders who like to make quick decisions and make money from differences in price referred to as short-term trading (scalpers) and also proves to be vital and very effective for long-term traders (positional traders).
This article teaches you how to create an Expert Advisor that detects support and resistance zones drawn on the chart and executes trades automatically based on them.
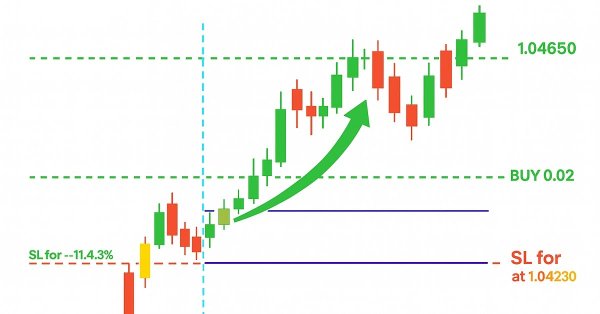
For many traders, it's a familiar pain point: watching a trade come within a whisker of your profit target, only to reverse and hit your stop-loss. Or worse, seeing a trailing stop close you out at breakeven before the market surges toward your original target. This article focuses on using multiple entries at different Reward-to-Risk Ratios to systematically secure gains and reduce overall risk exposure.
In this article, we'll cover the basics of risk management in trading and learn how to create your first functions for calculating the appropriate lot size for a trade, as well as a stop-loss. Additionally, we will go into detail about how these features work, explaining each step. Our goal is to provide a clear understanding of how to apply these concepts in automated trading. Finally, we will put everything into practice by creating a simple script with an include file.
This article explores how to build an Opening Range Breakout (ORB) Expert Advisor in MQL5. It explains how the EA identifies breakouts from the market’s initial range and opens trades accordingly. You’ll also learn how to control the number of positions opened and set a specific cutoff time to stop trading automatically.
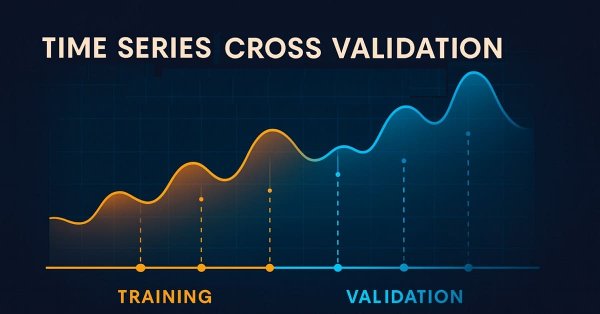
In this series of articles, we look at the challenges faced by algorithmic traders when deploying machine-learning-powered trading strategies. Some challenges within our community remain unseen because they demand deeper technical understanding. Today’s discussion acts as a springboard toward examining the blind spots of cross-validation in machine learning. Although often treated as routine, this step can easily produce misleading or suboptimal results if handled carelessly. This article briefly revisits the essentials of time series cross-validation to prepare us for more in-depth insight into its hidden blind spots.
Many traders have experienced this situation, often stick to their entry criteria but struggle with trade management. Even with the right setups, emotional decision-making—such as panic exits before trades reach their take-profit or stop-loss levels—can lead to a declining equity curve. How can traders overcome this issue and improve their results? This article will address these questions by examining random win-rates and demonstrating, through Monte Carlo simulation, how traders can refine their strategies by taking profits at reasonable levels before the original target is reached.
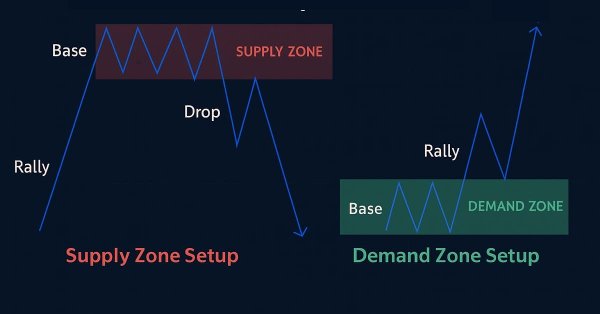
In this article, we create a supply and demand trading system in MQL5 that identifies supply and demand zones through consolidation ranges, validates them with impulsive moves, and trades retests with trend confirmation and customizable risk parameters. The system visualizes zones with dynamic labels and colors, supporting trailing stops for risk management.
In this article, you will learn how to develop an Order Blocks indicator based on order book volume (market depth) and optimize it using buffers to improve accuracy. This concludes the current stage of the project and prepares for the next phase, which will include the implementation of a risk management class and a trading bot that uses signals generated by the indicator.
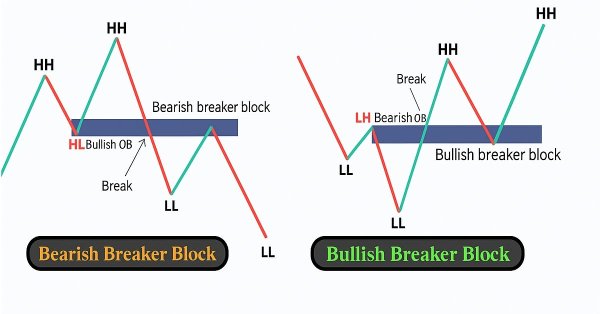
In this article, we create a Breaker Block Trading System in MQL5 that identifies consolidation ranges, detects breakouts, and validates breaker blocks with swing points to trade retests with defined risk parameters. The system visualizes order and breaker blocks with dynamic labels and arrows, supporting automated trading and trailing stops.
In this article, we develop an MQL5 First Run User Setup Wizard for Expert Advisors, featuring a scrollable guide with an interactive dashboard, dynamic text formatting, and visual controls like buttons and a checkbox allowing users to navigate instructions and configure trading parameters efficiently. Users of the program get to have insight of what the program is all about and what to do on the first run, more like an orientation model.
The article considers a new population optimization algorithm - Cyclic Parthenogenesis Algorithm (CPA), inspired by the unique reproductive strategy of aphids. The algorithm combines two reproduction mechanisms — parthenogenesis and sexual reproduction — and also utilizes the colonial structure of the population with the possibility of migration between colonies. The key features of the algorithm are adaptive switching between different reproductive strategies and a system of information exchange between colonies through the flight mechanism.
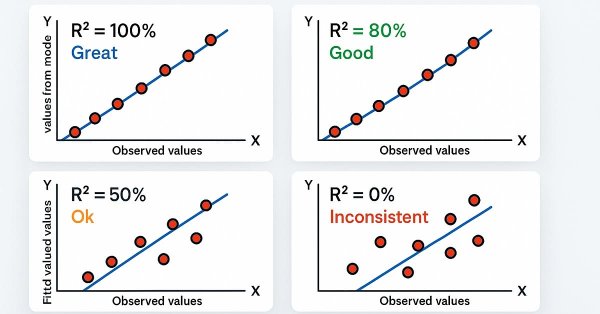
In this article, we develop a Trendline Breakout System in MQL5 that identifies support and resistance trendlines using swing points, validated by R-squared goodness of fit and angle constraints, to automate breakout trades. Our plan is to detect swing highs and lows within a specified lookback period, construct trendlines with a minimum number of touch points, and validate them using R-squared metrics and angle constraints to ensure reliability.
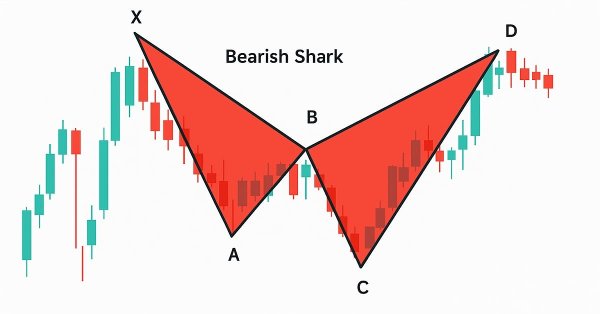
In this article, we develop a Shark pattern system in MQL5 that identifies bullish and bearish Shark harmonic patterns using pivot points and Fibonacci ratios, executing trades with customizable entry, stop-loss, and take-profit levels based on user-selected options. We enhance trader insight with visual feedback through chart objects like triangles, trendlines, and labels to clearly display the X-A-B-C-D pattern structure
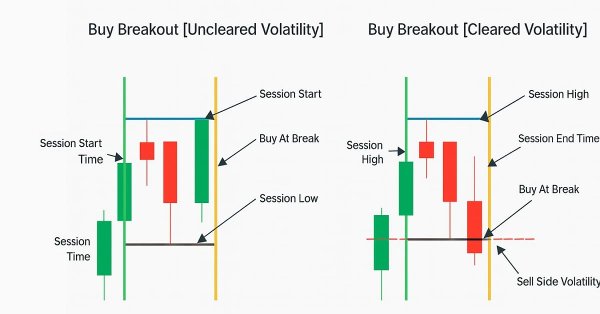
Volatility based breakout system identifies market ranges, then trades when price breaks above or below those levels, filtered by volatility measures such as ATR. This approach helps capture strong directional moves.
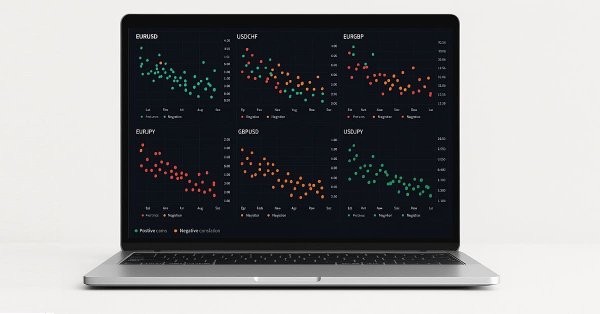
In this discussion, we will explore how the concept of Financial Correlation can be applied to improve decision-making efficiency when trading multiple symbols during major economic events announcement. The focus is on addressing the challenge of heightened risk exposure caused by increased volatility during news releases.
Learn how to detect and display the Gartley harmonic pattern in MetaTrader 5 using MQL5. This article explains each step of the process, from identifying swing points to applying Fibonacci ratios and plotting the full pattern on the chart for clear visual confirmation.
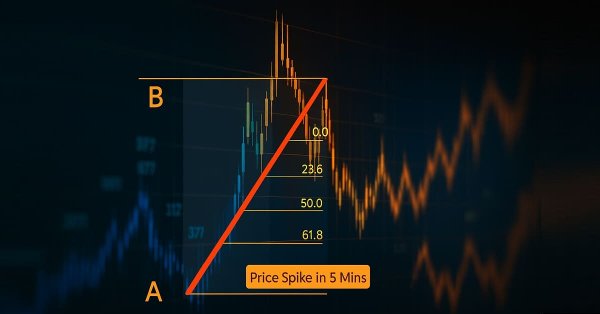
In financial markets, the laws of retracement remain among the most undeniable forces. It is a rule of thumb that price will always retrace—whether in large moves or even within the smallest tick patterns, which often appear as a zigzag. However, the retracement pattern itself is never fixed; it remains uncertain and subject to anticipation. This uncertainty explains why traders rely on multiple Fibonacci levels, each carrying a certain probability of influence. In this discussion, we introduce a refined strategy that applies Fibonacci techniques to address the challenges of trading shortly after major economic event announcements. By combining retracement principles with event-driven market behavior, we aim to uncover more reliable entry and exit opportunities. Join to explore the full discussion and see how Fibonacci can be adapted to post-event trading.
In this article, we develop a 5 Drives pattern system in MQL5 that identifies bullish and bearish 5 Drives harmonic patterns using pivot points and Fibonacci ratios, executing trades with customizable entry, stop loss, and take-profit levels based on user-selected options. We enhance trader insight with visual feedback through chart objects like triangles, trendlines, and labels to clearly display the A-B-C-D-E-F pattern structure.
This is an article that I have written aimed to expound and explain Fair Value Gaps, their formation logic for occurring, and automated trading with breakers and market structure shifts.
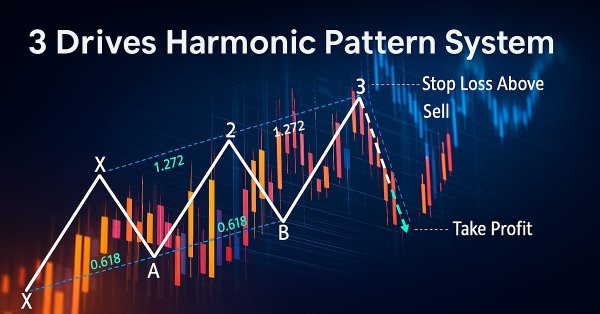
In this article, we develop a 3 Drives Pattern system in MQL5 that identifies bullish and bearish 3 Drives harmonic patterns using pivot points and Fibonacci ratios, executing trades with customizable entry, stop loss, and take-profit levels based on user-selected options. We enhance trader insight with visual feedback through chart objects.
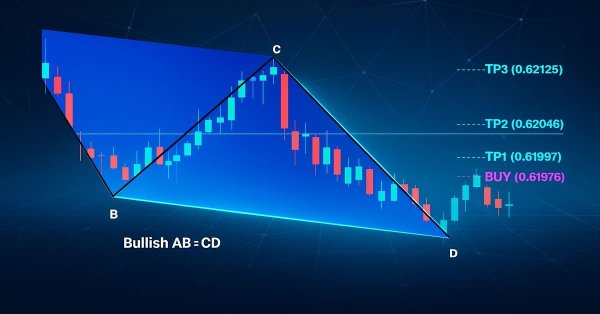
In this article, we develop an AB=CD Pattern EA in MQL5 that identifies bullish and bearish AB=CD harmonic patterns using pivot points and Fibonacci ratios, executing trades with precise entry, stop loss, and take-profit levels. We enhance trader insight with visual feedback through chart objects.
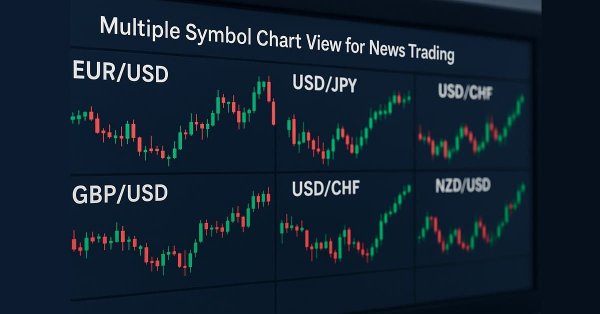
Today we will develop a multi-chart view system using chart objects. The goal is to enhance news trading by applying MQL5 algorithms that help reduce trader reaction time during periods of high volatility, such as major news releases. In this case, we provide traders with an integrated way to monitor multiple major symbols within a single all-in-one news trading tool. Our work is continuously advancing with the News Headline EA, which now features a growing set of functions that add real value both for traders using fully automated systems and for those who prefer manual trading assisted by algorithms. Explore more knowledge, insights, and practical ideas by clicking through and joining this discussion.
This article is about orthogonal polynomials. Their use can become the basis for a more accurate and effective analysis of market information allowing traders to make more informed decisions.