In this article, we develop a Change of Character (CHoCH) detection system in MQL5 that identifies swing highs and lows over a user-defined bar length, labels them as HH/LH for highs or LL/HL for lows to determine trend direction, and triggers trades on breaks of these swing points, indicating a potential reversal, and trades the breaks when the structure changes.
A multi-task learning framework based on ResNeXt optimizes the analysis of financial data, taking into account its high dimensionality, nonlinearity, and time dependencies. The use of group convolution and specialized heads allows the model to effectively extract key features from the input data.
In this session, we will build a sophisticated, multi-signal Expert Advisor using the MQL5 Standard Library. This approach allows us to seamlessly blend built-in signals with our own custom logic, demonstrating how to construct a powerful and flexible trading algorithm. For more, click to read further.
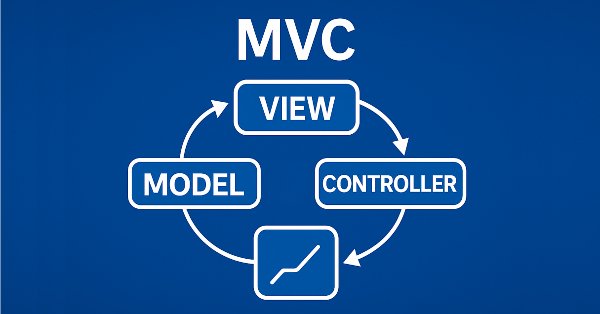
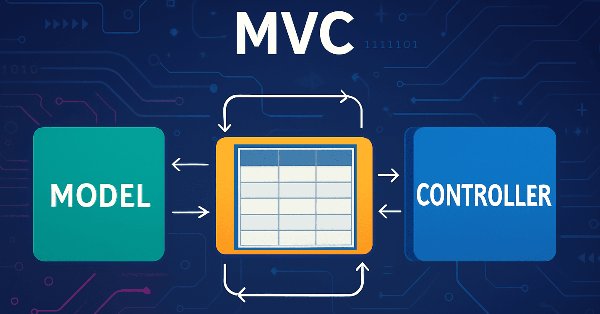
The article covers the process of developing a base graphical element for the View component as part of the implementation of tables in the MVC (Model-View-Controller) paradigm in MQL5. This is the first article on the View component and the third one in a series of articles on creating tables for the MetaTrader 5 client terminal.
In this article, we implement an adaptive Linear Regression Channel system in MQL5 that automatically calculates the regression line and standard deviation channel over a user-defined period, only activates when the slope exceeds a minimum threshold to confirm a clear trend, and dynamically recreates or extends the channel when the price breaks out by a configurable percentage of channel width.
This article introduces the Pattern Density Heatmap, a price‑action mapping tool that transforms repeated candlestick pattern detections into statistically significant support and resistance zones. Rather than treating each signal in isolation, the EA aggregates detections into fixed price bins, scores their density with optional recency weighting, and confirms levels against higher‑timeframe data. The resulting heatmap reveals where the market has historically reacted—levels that can be used proactively for trade timing, risk management, and strategy confidence across any trading style.
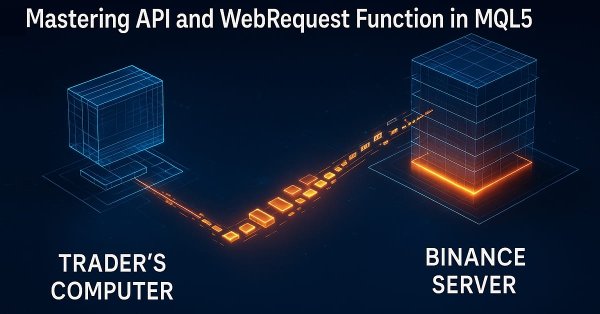
In this article, we continue mastering API and WebRequest in MQL5 by retrieving candlestick data from an external source. We focus on splitting the server response, cleaning the data, and extracting essential elements such as opening time and OHLC values for multiple daily candles, preparing the data for further analysis.
Today, we use the MQL5 Standard Library to build custom signal classes and let the MQL5 Wizard assemble a professional Expert Advisor for us. This approach simplifies development so that even beginner programmers can create robust EAs without in-depth coding knowledge, focusing instead on tuning inputs and optimizing performance. Join this discussion as we explore the process step by step.
Today we will begin to study structures in a simpler, more practical, and comfortable way. Structures are among the foundations of programming, whether they are structured or not. I know many people think of structures as just collections of data, but I assure you that they are much more than just structures. And here we will begin to explore this new universe in the most didactic way.
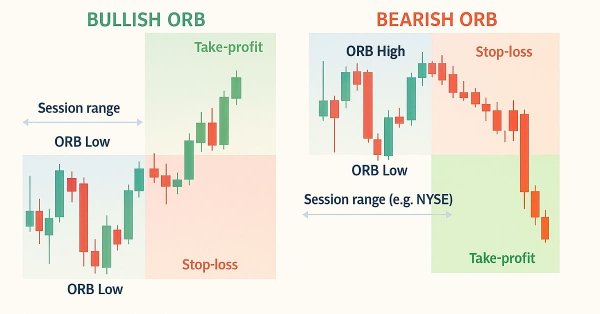
In this article, we create a fully customizable session-based Opening Range Breakout (ORB) system in MQL5 that lets us set any desired session start time and range duration, automatically calculates the high and low of that opening period, and trades only confirmed breakouts in the direction of the move.
Tired of watching progress bars instead of testing trading strategies? Traditional caching fails financial ML, leaving you with lost computations and frustrating restarts. We've engineered a sophisticated caching architecture that understands the unique challenges of financial data—temporal dependencies, complex data structures, and the constant threat of look-ahead bias. Our three-layer system delivers dramatic speed improvements while automatically invalidating stale results and preventing costly data leaks. Stop waiting for computations and start iterating at the pace the markets demand.
In this article, we look to explore how a complimentary indicator pairing can be used to analyze the recent 5-year history of Vanguard Information Technology Index Fund ETF. By considering two options of algorithms, Kendall’s Tau and Distance-Correlation, we look to select not just an ideal indicator pair for trading the VGT, but also suitable signal-pattern pairings of these two indicators.
We aim to create a system for automatic periodic optimization of trading strategies used in one final EA. As the system evolves, it becomes increasingly complex, so it is necessary to look at it as a whole from time to time in order to identify bottlenecks and suboptimal solutions.
Sockets. Do you know what they are for or how to use them in MetaTrader 5? If the answer is no, let's start by studying them. In today's article, we'll cover the basics. Since there are several ways to do the same thing, and we are always interested in the result, I want to show that there is indeed a simple way to transfer data from MetaTrader 5 to other programs, such as Excel. However, the main idea is not to transfer data from MetaTrader 5 to Excel, but the opposite, that is, to transfer data from Excel or any other program to MetaTrader 5.
We continue to build the Hidformer hierarchical dual-tower transformer model designed for analyzing and forecasting complex multivariate time series. In this article, we will bring the work we started earlier to its logical conclusion — we will test the model on real historical data.
This article presents the Multi‑Timeframe Visual Analyzer, an MQL5 Expert Advisor that reconstructs and overlays higher‑timeframe candles directly onto your active chart. It explains the implementation, key inputs, and practical outcomes, supported by an animated demo and chart examples showing instant toggling, multi‑timeframe confirmation, and configurable alerts. Read on to see how this tool can make chart analysis faster, clearer, and more efficient.
Unlike MQL5, Python programming language offers control and flexibility when it comes to dealing with and manipulating time. In this article, we will implement similar modules for better handling of dates and time in MQL5 as in Python.
Learn how to build a complete Kagi Chart engine in MQL5—constructing price reversals, generating dynamic line segments, and updating Kagi structures in real time. This first part teaches you how to render Kagi charts directly on MetaTrader 5, giving traders a clear view of trend shifts and market strength while preparing for automated Kagi-based trading logic in Part 2.
This article shows how to configure a black-box model to automatically uncover strong trading strategies using a data-driven approach. By using Mutual Information to prioritize the most learnable signals, we can build smarter and more adaptive models that outperform conventional methods. Readers will also learn to avoid common pitfalls like overreliance on surface-level metrics, and instead develop strategies rooted in meaningful statistical insight.
This is the second part of the article devoted to the implementation of the table model in MQL5 using the MVC (Model-View-Controller) architectural paradigm. The article discusses the development of table classes and the table header based on a previously created table model. The developed classes will form the basis for further implementation of View and Controller components, which will be discussed in the following articles.
The relentless quest to decode market rhythms has led traders and quantitative analysts to develop countless mathematical models. This article has introduced the Flower Volatility Index (FVI), a novel approach that transforms the mathematical elegance of Rose Curves into a functional trading tool. Through this work, we have shown how mathematical models can be adapted into practical trading mechanisms capable of supporting both analysis and decision-making in real market conditions.
This article teaches you how to retrieve and extract price data from external platforms using APIs and the WebRequest function in MQL5. You’ll learn how URLs are structured, how API responses are formatted, how to convert server data into readable strings, and how to identify and extract specific values from JSON responses.
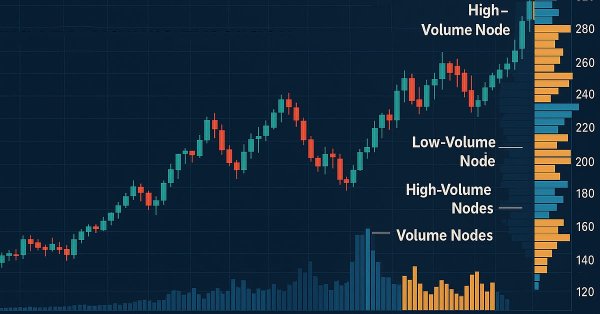
Analytical Volume Profile Trading (AVPT) explores how liquidity architecture and market memory shape price behavior, enabling more profound insight into institutional positioning and volume-driven structure. By mapping POC, HVNs, LVNs, and Value Areas, traders can identify acceptance, rejection, and imbalance zones with precision.
This article is intended for algorithmic traders, quantitative analysts, and MQL5 developers interested in enhancing their understanding of candlestick pattern recognition through practical implementation. It provides an in‑depth exploration of the CandlePatternSearch.mq5 Expert Advisor—a complete framework for detecting, visualizing, and monitoring classical candlestick formations in MetaTrader 5. Beyond a line‑by‑line review of the code, the article discusses architectural design, pattern detection logic, GUI integration, and alert mechanisms, illustrating how traditional price‑action analysis can be automated efficiently.
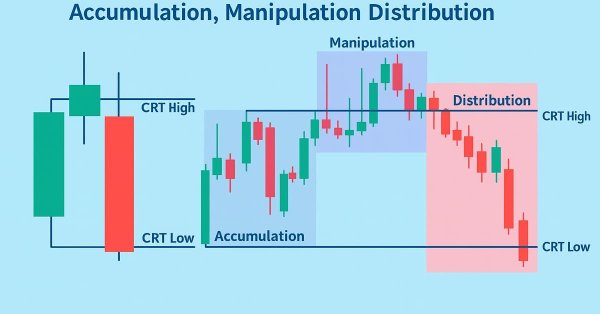
In this article, we develop a Candle Range Theory (CRT) trading system in MQL5 that identifies accumulation ranges on a specified timeframe, detects breaches with manipulation depth filtering, and confirms reversals for entry trades in the distribution phase. The system supports dynamic or static stop-loss and take-profit calculations based on risk-reward ratios, optional trailing stops, and limits on positions per direction for controlled risk management.
Gamma and Delta were originally developed as risk-management tools for hedging options exposure, but over time they evolved into powerful instruments for advanced scalping, order-flow modeling, and microstructure trading. Today, they serve as real-time indicators of price sensitivity and liquidity behavior, enabling traders to anticipate short-term volatility with remarkable precision.
This article demonstrates how to automatically identify potentially profitable trading strategies using MetaTrader 5. White-box solutions, powered by unsupervised matrix factorization, are faster to configure, more interpretable, and provide clear guidance on which strategies to retain. Black-box solutions, while more time-consuming, are better suited for complex market conditions that white-box approaches may not capture. Join us as we discuss how our trading strategies can help us carefully identify profitable strategies under any circumstance.
In this article, we will look at how to improve and more effectively apply the concepts presented in the previous article using the powerful MQL5 graphical control libraries. We'll go step by step through the process of creating a fully functional GUI. I'll be explaining the ideas behind it, as well as the purpose and operation of each method used. Additionally, at the end of the article, we will test the panel we created to ensure it functions correctly and meets its stated goals.
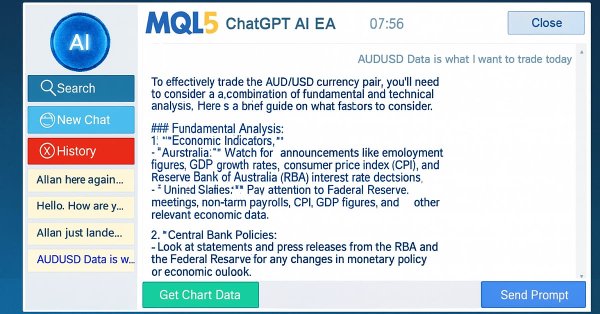
In Part 6 of our MQL5 AI trading system series, we advance the ChatGPT-integrated Expert Advisor by introducing chat deletion functionality through interactive delete buttons in the sidebar, small/large history popups, and a new search popup, allowing traders to manage and organize persistent conversations efficiently while maintaining encrypted storage and AI-driven signals from chart data.
We continue our new series on Market-Positioning, where we study particular assets, with specific trade directions over manageable test windows. We started this by considering Nvidia Corp stock in the last article, where we covered 5 signal patterns from the complimentary pairing of the RSI and DeMarker oscillators. For this article, we cover the remaining 5 patterns and also delve into multi-pattern options that not only feature untethered combinations of all ten, but also specialized combinations of just a pair.
Generating new indicators from existing ones offers a powerful way to enhance trading analysis. By defining a mathematical function that integrates the outputs of existing indicators, traders can create hybrid indicators that consolidate multiple signals into a single, efficient tool. This article introduces a new indicator built from three oscillators using a modified version of the Pearson correlation function, which we call the Pseudo Pearson Correlation (PPC). The PPC indicator aims to quantify the dynamic relationship between oscillators and apply it within a practical trading strategy.
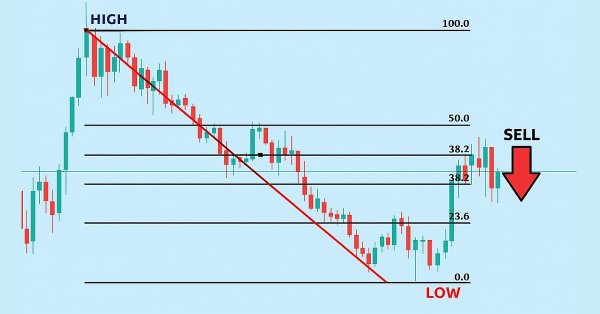
Fibonacci levels provide a practical framework that markets often respect, highlighting price zones where reactions are more likely. In this article, we build an expert advisor that applies Fibonacci retracement logic to anticipate likely future moves and trade retracements with pending orders. Explore the full workflow—from swing detection to level plotting, risk controls, and execution.
In this article, we look at the process of developing a table model in MQL5 using the MVC (Model-View-Controller) architectural pattern to separate data logic, presentation, and control, enabling structured, flexible, and scalable code. We consider implementation of classes for building a table model, including the use of linked lists for storing data.
We invite you to get acquainted with the Hierarchical Double-Tower Transformer (Hidformer) framework, which was developed for time series forecasting and data analysis. The framework authors proposed several improvements to the Transformer architecture, which resulted in increased forecast accuracy and reduced computational resource consumption.
Many traders struggle to identify genuine reversals. This article presents an EA that combines RVGI, CCI (±100), and an SMA trend filter to produce a single clear reversal signal. The EA includes an on-chart panel, configurable alerts, and the full source file for immediate download and testing.
Many people, especially non=programmers, find it very difficult to transfer information between MetaTrader 5 and other programs. One such program is Excel. Many use Excel as a way to manage and maintain their risk control. It is an excellent program and easy to learn, even for those who are not VBA programmers. Here we will look at how to establish a connection between MetaTrader 5 and Excel (a very simple method).
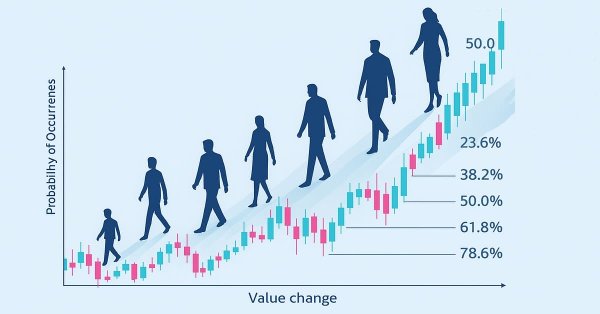
In this article, we build an MQL5 Expert Advisor for Fibonacci retracement trading, using either daily candle ranges or lookback arrays to calculate custom levels like 50% and 61.8% for entries, determining bullish or bearish setups based on close vs. open. The system triggers buys or sells on price crossings of levels with max trades per level, optional closure on new Fib calcs, points-based trailing stops after a min profit threshold, and SL/TP buffers as percentages of the range.
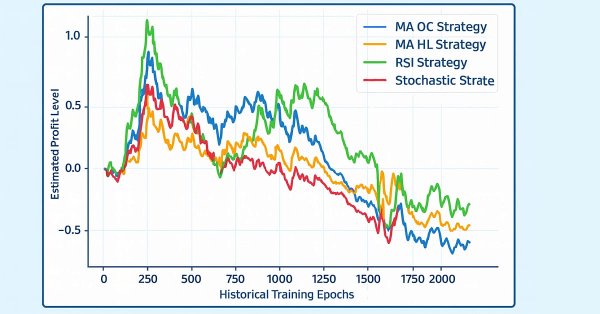
All algorithmic trading strategies are difficult to set up and maintain, regardless of complexity—a challenge shared by beginners and experts alike. This article introduces an ensemble framework where supervised models and human intuition work together to overcome their shared limitations. By aligning a moving average channel strategy with a Ridge Regression model on the same indicators, we achieve centralized control, faster self-correction, and profitability from otherwise unprofitable systems.
We commence a new article series that builds upon our earlier efforts laid out in the MQL5 Wizard series, by taking them further as we step up our approach to systematic trading and strategy testing. Within these new series, we’ll concentrate our focus on Expert Advisors that are coded to hold only a single type of position - primarily longs. Focusing on just one market trend can simplify analysis, lessen strategy complexity and expose some key insights, especially when dealing in assets beyond forex. Our series, therefore, will investigate if this is effective in equities and other non-forex assets, where long only systems usually correlate well with smart money or institution strategies.
In this part, we focus on how to merge real-time market feedback—such as live trade outcomes, volatility changes, and liquidity shifts—with adaptive model learning to maintain a responsive and self-improving trading system.