We continue to build the algorithms that form the basis of the DADA framework, which is an advanced tool for detecting anomalies in time series. This approach enables effective distinguishing random fluctuations from significant deviations. Unlike classical methods, DADA dynamically adapts to different data types, choosing the optimal compression level in each specific case.
Deterministic Oscillatory Search (DOS) algorithm is an innovative global optimization method that combines the advantages of gradient and swarm algorithms without the use of random numbers. The fitness oscillation and slope mechanism allows DOS to explore complex search spaces in a deterministic manner.
This article implements an MQL5 module that analyzes the lower‑timeframe bars inside each liquidity‑zone base candle. It detects swing points and applies objective rules to classify the internal structure as an ascending, descending, or symmetrical triangle; a rectangle; M; W; or undefined. The indicator displays geometry labels on the chart and adds the pattern to alerts, reducing manual lower‑timeframe inspection.
An MQL5 control system that blocks orders outside scheduled trading hours and during scheduled news releases, converting time rules into executable restrictions. It combines a permissions management mechanism, a transaction-level expert advisor, and a visual dashboard for real-time status and upcoming restrictions. Configuration is accomplished using editable files, with caching and a CSV audit log for traceability.
We expand the capabilities of the MetaTrader 5 butterfly curve canvas by adding multi-layered wing fills, vein lines, scale dots, and a full body (abdomen, thorax, head, eyes, antennae). This article implements polygon fills with vertical and radial gradients, as well as filled circles and ellipses, all using supersampling antialiasing. You will also receive reusable MQL5 helper functions and a rendering order that transforms a simple curve into a customizable, detailed chart illustration.
We build a production MQL5 bet‑sizing toolkit: utilities, snippets, and user‑level functions that mirror the Python originals. The methods cover probability‑to‑size mapping with overlap correction, dynamic forecast‑price sizing (calibrated sigmoid/power with limit price), occupancy‑based budgeting, and mixture‑model reserve sizing (EF3M). The result is a signed [−1, ..., 1] position plus diagnostics you can plug directly into order logic.
Self-training EA with a neural network based on a state matrix. We combine Markov chains with a multilayer neural network MLP developed using the ALGLIB MQL5 library. How can Markov chains and neural networks be combined for Forex forecasting?
Forecasting the movements of currency pairs is an important factor in trading success. This article explores various price movement models, analyzes their advantages and disadvantages, and explores their practical application in trading strategies. We will consider approaches that allow us to identify hidden patterns and improve the accuracy of forecasts.
Create a traditional Renko indicator in MQL5 that converts candlestick closing prices into fixed-size blocks displayed on the main chart. We calculate the movement from the closing price of the last block, create new blocks of a user-defined size, confirm reversals using the two-block rule, manage block closing prices in a dynamic array, and display rectangles for visualizing the trend in real time.
We are going to create a matrix forecasting model based on a Markov chain. What are Markov chains, and how can we use a Markov chain for Forex trading?
The article presents an MQL5 method for detecting psychological round numbers by converting prices to strings and counting trailing zeros (ZeroSize). It outlines the theory of institutional liquidity at integers, explains the GetZeroCount logic with tick-size normalization to avoid floating‑point errors, and details hierarchical visualization. Case studies across forex, metals, and crypto, plus timeframe filters and inputs, show how to use confluence and basic risk controls in practice.
Head and Shoulders patterns are difficult to identify consistently in live market data due to noise and structural ambiguity. This article presents a structured, triangle-based MQL5 indicator that isolates pattern components, constructs the neckline, and validates formations using ATR, symmetry, and slope constraints. The system detects and draws standard and inverse patterns, assigns a quality score, and confirms breakouts with optional alerts, enabling consistent and rule-based chart analysis.
We design a simple external trade analytics pipeline for MetaTrader 5 and implement its backend in Python with Flask and SQLite. The article defines the architecture, data model, and versioned API, and shows how to configure the environment, initialize the database, and run the server locally. As a result, you get a clean base to capture closed-trade records from MetaTrader 5 and store them for later analysis.
Computer vision for trading: how it works and how to develop it step by step. We create an algorithm for recognition of RGB images of price charts using the attention mechanism and a bidirectional LSTM layer. As a result, we obtain a working model for forecasting the EURUSD price with the accuracy of up to 55% in the validation section.
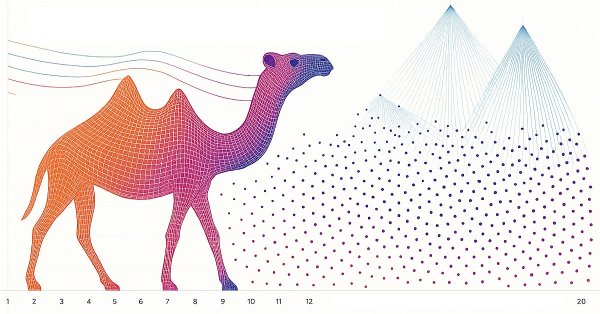
The Camel Algorithm, developed in 2016, simulates the behavior of camels in the desert to solve optimization problems, taking into account temperature, supply, and endurance. This article also presents a modified version of the algorithm (CAm) with key improvements: the use of a Gaussian distribution in generating solutions and the optimization of the oasis effect parameters.
The article discusses the non-parametric HSIC (Hilbert-Schmidt Independence Criterion) statistical test designed to identify linear and non-linear dependencies in data. Implementations of two algorithms for calculating HSIC in the MQL5 language are proposed: the exact permutation test and the gamma approximation. The method efficiency is demonstrated on synthetic data modeling a non-linear relationship between features and the target variable.
This article presents an EA that automates the previously introduced Market Entropy methodology. It computes fast and slow entropy, momentum, and compression states, validates signals, and executes orders with SL/TP and optional position reversal. The result is a practical, configurable tool that applies information-theoretic signals without manual interpretation.
In this article, we explore the butterfly curve, a parametric mathematical equation, and render it visually on a MQL5 canvas. We build an interactive display with a draggable, resizable canvas window, supersampled curve rendering, gradient backgrounds, and a color-segmented legend. By the end, we have a fully functional visual tool that plots the butterfly curve directly on the MetaTrader 5 chart.
Time series forecasting in trading has evolved from traditional statistical models (like ARIMA) to deep learning approaches, but both require heavy tuning and training. Inspired by advances in NLP, Google’s TimesFM introduces a pretrained “foundation model” for time series that can perform strong forecasts even without task-specific training. For traders, this is powerful because it can be efficiently fine-tuned on their own data using lightweight methods like LoRA, reducing overfitting while adapting to changing market conditions.
This article builds the user interface layer of an Account Audit System in MQL5 using CChartObject classes. We construct an on-chart dashboard that displays key metrics such as start/end balance, net profit, total trades, wins/losses, win rate, withdrawals, and a star-based performance rating. A menu button lets you show or hide the panel and restores one-click trading, delivering a clean, usable foundation for the broader audit pipeline.
Build a local, bidirectional voice interface for MetaTrader 5 using MQL5 WebRequest and two Python services. The article implements offline speech recognition with Vosk, wake‑word detection, an HTTP command endpoint, and a text‑to‑speech server on localhost. You will wire an Expert Advisor that fetches commands, executes trades, and returns spoken confirmations for hands‑free operation.
Hidden Markov Models (HMMs) are a powerful class of probabilistic models designed to analyze sequential data, where observed events depend on some sequence of unobserved (hidden) states that form a Markov process. The main assumptions of HMM include the Markov property for hidden states, meaning that the probability of transition to the next state depends only on the current state, and the independence of observations given knowledge of the current hidden state.
This article explores the practical application of L1 trend filtering in MetaTrader 5, covering both its mathematical foundations and usage in MQL5 programs. The L1 filter enables extraction of piecewise-linear trends that preserve essential market structure while reducing price noise. The study analyzes parameter scaling, trend estimation behavior, and integration of the method into algorithmic trading strategies. Experimental results demonstrate how L1 trend filtering can enhance signal stability, trade timing, and overall robustness of trading systems.
The article presents a new metaheuristic method based on a fractal approach to partitioning the search space for solving optimization problems. The algorithm sequentially identifies and separates promising areas, creating a self-similar fractal structure that concentrates computing resources on the most promising areas. A unique mutation mechanism aimed at better solutions ensures an optimal balance between exploration and exploitation of the search space, significantly increasing the efficiency of the algorithm.
We revamp our earlier articles on testing trade setups with the MQL5 Wizard by putting a bit more emphasis on input data quality, cleaning, and handling. In the earlier articles we had looked at a lot of custom signal classes, usable by the wizard, so we now shift our focus to a custom trailing class, given that exiting is also a very important part in any trading system. Our broad theme for this particular piece data-efficiency and the O(1) range-query; the core ‘tech’ is MQL5, SQLite, Python-Polars; the Algorithm is the Sparse-Table while we will seek validation from the ATR Indicator.
GoertzelBrain combines Goertzel spectral analysis with an online‑trained neural network ensemble to convert cycle features into a directional confirmation signal. The indicator builds a compact feature vector from the dominant period, amplitude, confidence and their dynamics, plus local volatility, and outputs +1, −1 or 0. The article provides the full MQL5 implementation, explains the architecture and feature engineering, and shows how to use it as a directional filter.
Integer differentiation forces a binary choice between stationarity and memory: returns (d=1) are stationary but discard all price-level information; raw prices (d=0) preserve memory but violate ML stationarity assumptions. We implement the fixed-width fractional differentiation (FFD) method from AFML Chapter 5, covering get_weights_ffd (iterative recurrence with threshold cutoff), frac_diff_ffd (bounded dot product per bar), and fracdiff_optimal (binary search for minimum stationary d*).
This article presents a Time-of-Day capital rotation engine for MQL5 that allocates risk by trading session instead of using uniform exposure. We detail session budgets within a daily risk cap, dynamic lot sizing from remaining session risk, and automatic daily resets. Execution uses session-specific breakout and fade logic with ATR-based volatility confirmation. Readers gain a practical template to deploy capital where session conditions are statistically strongest while keeping exposure controlled throughout the day.
Tree-based classifiers are typically overconfident: true win rates near 0.55 appear as 0.65–0.80 and inflate position sizes and Kelly fractions. This article presents afml.calibration and CalibratorCV, which generate out-of-fold predictions via PurgedKFold and fit isotonic regression or Platt scaling. We define Brier score, ECE, and MCE, and show diagnostics that trace miscalibration into position sizes, realized P&L, and CPCV path Sharpe distributions to support leakage-free, correctly sized trading.
The article contains a detailed description of the cross-rate calculation algorithm, a visualization of the imbalance matrix, and recommendations for optimally setting the MinDiscrepancy and MaxRisk parameters for efficient trading. The system automatically calculates the "fair value" of each currency pair using cross rates, generating buy signals in case of negative deviations and sell signals in case of positive ones.
We continue studying the chaotic optimization algorithm. The second part of the article deals with the practical aspects of the algorithm implementation, its testing and conclusions.
This is an improved chaotic optimization algorithm (COA) that combines the effects of chaos with adaptive search mechanisms. The algorithm uses a set of chaotic maps and inertial components to explore the search space. The article reveals the theoretical foundations of chaotic methods of financial optimization.
This article demonstrates how to run DOOM inside MetaTrader 5 by integrating a native Windows DLL with an MQL5 Expert Advisor. We cover building the DLL, real-time framebuffer rendering via ResourceCreate, keyboard input with a key-up workaround using GetAsyncKeyState, and running the game loop on a background thread. The techniques are directly applicable to custom visualization, external data bridges, and robust MQL5–native code integration.
Build a rule-based on-chart risk management panel in MetaTrader 5 using the MQL5 Standard Library. The guide covers a CAppDialog-based GUI, manual event routing, and an automated update loop. You will bind UI events to CTrade to execute conditional closures, show net floating P/L, and read automated targets directly from the chart.
The article demonstrates how to build a Volume Bubble Indicator in MQL5 that visualizes market activity using statistical normalization. It covers how to work with tick and real volume, compute the mean and standard deviation over a rolling window, and normalize volume values to identify relative strength. You will implement chart objects to display bubbles with dynamic size and color, providing a clear representation of volume intensity directly on the chart.
This article extends the MQL5 footprint chart with market-structure and order-flow layers: volume-profile bars, point of control, value-area highlighting, stacked imbalance detection, absorption zones, and single-print/unfinished markers. We expand bar data structures, add functions for POC/value area, imbalance, and absorption, and build a fixed-order rendering pipeline. You will get ready-to-use inputs, metadata, and drawing utilities to integrate and customize these layers in your indicator.
Before moving forward with the development of multi-currency EAs, let's try to switch to creating a new project using the developed library. This example will demonstrate how to best organize source code storage and how using the new code repository from MetaQuotes can help us.
Most algo traders optimize Expert Advisors individually but never measure how they behave together on a single account. Correlated strategies amplify drawdowns instead of reducing them, and coverage gaps leave portfolios blind during entire trading sessions. This article builds a complete portfolio scorer in MQL5 that reads daily P&L from backtest CSV files, computes a full Pearson correlation matrix, maps trading activity by hour and weekday, evaluates asset class diversity, and outputs a composite grade from A+ to F. All source code is included; no external libraries are required.
How to use Renko bars with AI? Let's look at Renko trading on Forex with forecast accuracy of up to 59.27%. We will explore the benefits of Renko bars for filtering market noise, learn why volume is more important than price patterns, and how to set the optimal Renko block size for EURUSD. This is a step-by-step guide on integrating CatBoost, Python, and MetaTrader 5 to create your own Renko Forex forecasting system. It is ideal for traders looking to go beyond traditional technical analysis.
The article examines the theoretical and practical aspects of the singular spectrum analysis (SSA) method, which is an efficient method of time series analysis that allows one to represent the complex structure of a series as a decomposition into simple components, such as trend, seasonal (periodic) fluctuations and noise.