In this article, I will use experimentation and non-standard approaches to develop a profitable trading system and check whether neural networks can be of any help for traders.
Welcome to a new article in our series about how to design a trading system by the most popular technical indicators. In this article, we will learn about a new technical indicator and how to create a trading system using the Force Index indicator.
In this part we continue discussing Artificial Intelligence models. Namely, we study unsupervised learning algorithms. We have already discussed one of the clustering algorithms. In this article, I am sharing a variant of solving problems related to dimensionality reduction.
This is the first part of the new order system. Since we started documenting this EA in our articles, it has undergone various changes and improvements while maintaining the same on-chart order system model.
Welcome to our new article from our series about learning how to design a trading system by the most popular technical indicator. Through this new article, we will learn how to design a trading system by the Chaikin Oscillator indicator.
In this article we continue considering how to obtain data from the web and to use it in an Expert Advisor. This time we will proceed to developing an alternative system.
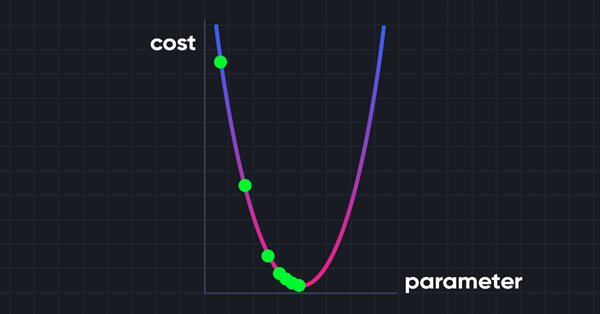
The gradient descent plays a significant role in training neural networks and many machine learning algorithms. It is a quick and intelligent algorithm despite its impressive work it is still misunderstood by a lot of data scientists let's see what it is all about.
The article considers the development of an MQL5 Expert Advisor (EA) for MetaTrader 5 aimed at working on MOEX. The EA is to follow a grid strategy while trading on MOEX using MetaTrader 5 terminal. The EA involves closing positions by stop loss and take profit, as well as removing pending orders in case of certain market conditions.
In the previous article, we have created a class for data clustering. In this article, I want to share variants of the possible application of obtained results in solving practical trading tasks.
Knowing how to input data from the Web into an Expert Advisor is not so obvious. It is not so easy to do without understanding all the possibilities offered by MetaTrader 5.
We continue to consider the clustering method. In this article, we will create a new CKmeans class to implement one of the most common k-means clustering methods. During tests, the model managed to identify about 500 patterns.
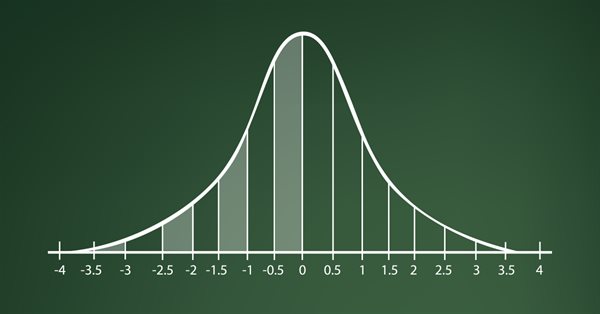
Here is a new article in our series about how to design a trading system by the most popular technical indicators in MetaTrader 5 trading platform. In this new article, we will learn how to design a trading system by Standard Deviation indicator.
Today we will add some more resources to our EA. This interesting article can provide some new ideas and methods of presenting information. At the same time, it can assist in fixing minor flaws in your projects.
These series of articles will proposition that the MQL5 Wizard should be a mainstay for traders. Why? Because not only does the trader save time by assembling his new ideas with the MQL5 Wizard, and greatly reduce mistakes from duplicate coding; he is ultimately set-up to channel his energy on the few critical areas of his trading philosophy.
It has been more than a year since I published my last article. This is quite a lot time to revise ideas and to develop new approaches. In the new article, I would like to divert from the previously used supervised learning method. This time we will dip into unsupervised learning algorithms. In particular, we will consider one of the clustering algorithms—k-means.
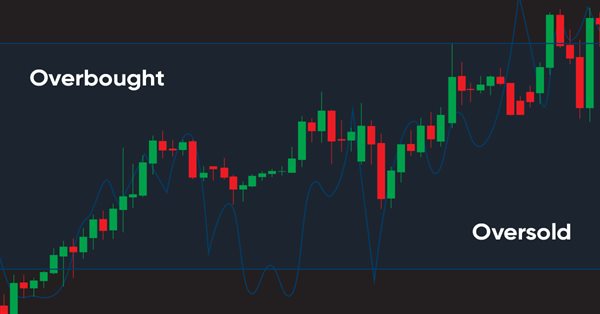
A new article in our series about learning how to design a trading system by the most popular technical indicators by MQL5 to be used in the MetaTrader 5. In this article, we will learn how to design a trading system by the Williams' %R indicator.
In this article we will create a system of cross orders. There is one type of assets that makes traders' life very difficult for traders — futures contracts. But why do they make life difficult?
How to access custom indicators directly in an Expert Advisor? A trading EA can be truly useful only if it can use custom indicators; otherwise, it is just a set of codes and instructions.
Decision trees imitate the way humans think to classify data. Let's see how to build trees and use them to classify and predict some data. The main goal of the decision trees algorithm is to separate the data with impurity and into pure or close to nodes.
In this article, we will place Chart Trade in a floating window. In the previous part, we created a basic system which enables the use of templates within a floating window.
Here is a new article in our series about how to design a trading system b the most popular indicators, we will talk about the Ichimoku indicator in detail and how to design a trading system by this indicator.
Todays trader is a philomath who is almost always (either consciously or not...) looking up new ideas, trying them out, choosing to modify them or discard them; an exploratory process that should cost a fair amount of diligence. This clearly places a premium on the trader's time and the need to avoid mistakes. These series of articles will proposition that the MQL5 wizard should be a mainstay for traders. Why? Because not only does the trader save time by assembling his new ideas with the MQL5 wizard, and greatly reduce mistakes from duplicate coding; he is ultimately set-up to channel his energy on the few critical areas of his trading philosophy.
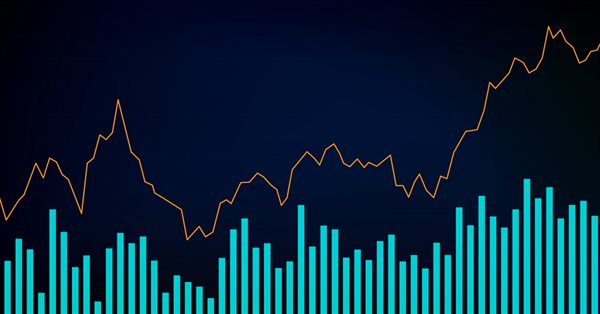
Here is a new article from our series about learning how to design a trading system based on the most popular technical indicators. The current article will be devoted to the Volumes indicator. Volume as a concept is one of the very important factors in financial markets trading and we have to pay attention to it. Through this article, we will learn how to design a simple trading system by Volumes indicator.
The new article from our series about designing a trading system based on the most popular technical indicators considers a new technical indicator - the Money Flow Index (MFI). We will learn it in detail and develop a simple trading system by means of MQL5 to execute it in MetaTrader 5.
In this article I am going to attempt to use our logistic model to predict the stock market crash based upon the fundamentals of the US economy, the NETFLIX and APPLE are the stocks we are going to focus on, Using the previous market crashes of 2019 and 2020 let's see how our model will perform in the current dooms and glooms.
Welcome to the new article from our series about learning how to design trading systems based on the most popular technical indicators. In this article, we will learn about a new technical indicator called Accumulation/Distribution indicator and find out how to design an MQL5 trading system based on simple AD trading strategies.
In this little video course you will learn how to download, install and setup MetaTrader 5 for Automated Trading. You will also learn how to adjust the chart settings and the options for automated trading. You will do your first backtest and by the end of this course you will know how to import an Expert Advisor that can automatically trade 24/7 while you don't have to sit in front of your screen.
This is one of the most powerful indicators currently existing. Anyone who trades trying to have a certain degree of confidence must have this indicator on their chart. Most often the indicator is used by those who prefer “tape reading” while trading. Also, this indicator can be utilized by those who use only Price Action while trading.
This is a new article to continue our series for beginners about how to design a trading system based on some of the popular indicators. We will learn a new indicator that is On Balance Volume (OBV), and we will learn how we can use it and design a trading system based on it.
The majority of students in my courses felt that MQL5 was really difficult to understand. In addition to this, they were searching for a straightforward method to automate a few processes. Find out how to begin working with MQL5 right now by reading the information contained in this article. Even if you have never done any form of programming before. And even in the event that you are unable to comprehend the previous illustrations that you have observed.
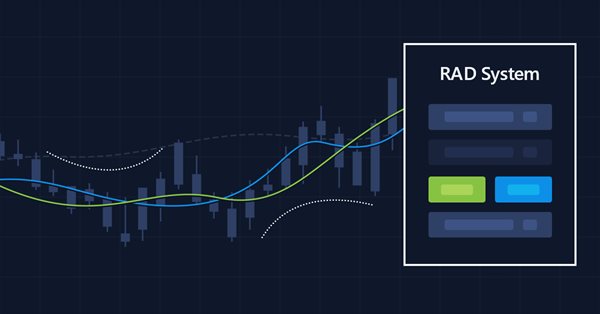
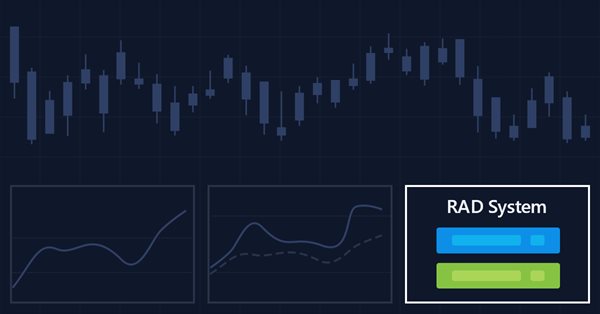
In my previous article, I showed you how to create a Chart Trade using MetaTrader 5 objects and thus to turn the platform into a RAD system. The system works very well, and for sure many of the readers might have thought about creating a library, which would allow having extended functionality in the proposed system. Based on this, it would be possible to develop a more intuitive Expert Advisor with a nicer and easier to use interface.
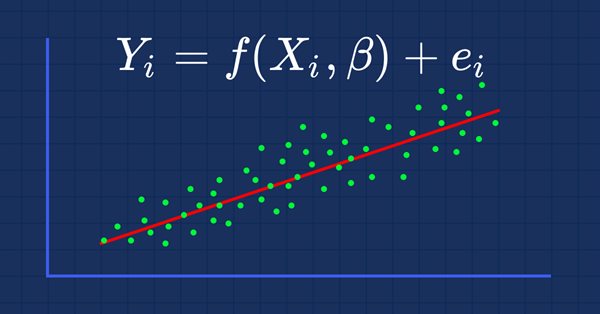
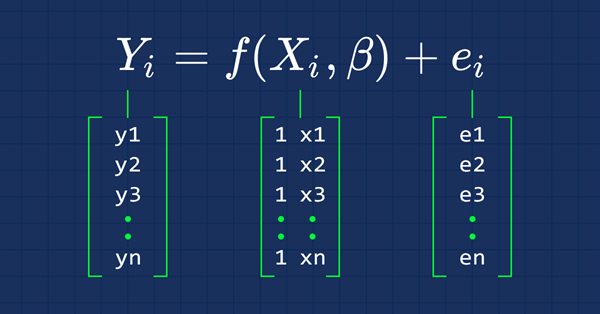
This time our models are being made by matrices, which allows flexibility while it allows us to make powerful models that can handle not only five independent variables but also many variables as long as we stay within the calculations limits of a computer, this article is going to be an interesting read, that's for sure.
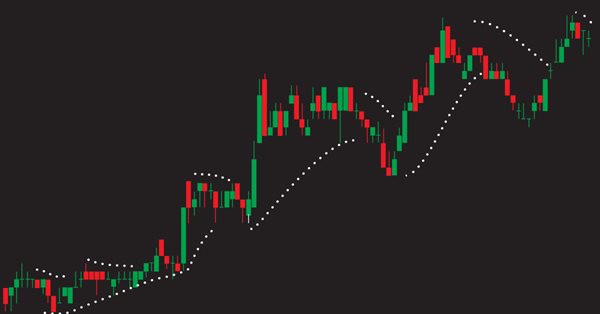
In this article, we will continue our series about how to design a trading system using the most popular indicators. In this article, we will learn about the Parabolic SAR indicator in detail and how we can design a trading system to be used in MetaTrader 5 using some simple strategies.
There are a lot of people who do not know how to program but they are quite creative and have great ideas. However, the lack of programming knowledge prevents them from implementing these ideas. Let's see together how to create a Chart Trade using the MetaTrader 5 platform itself, as if it were an IDE.
In my previous articles, I have explained how to create an indicator with multiple subwindows, which becomes interesting when using custom indicators. This time we will see how to add multiple windows to an Expert Advisor.
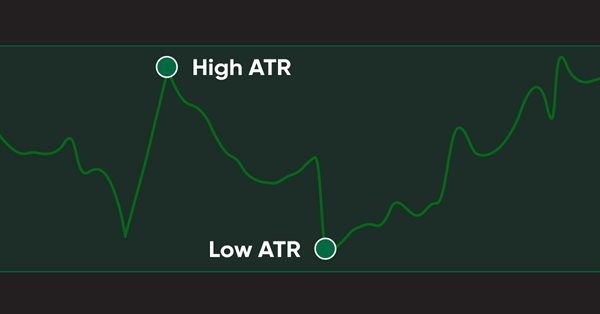
In this article, we will learn a new technical tool that can be used in trading, as a continuation within the series in which we learn how to design simple trading systems. This time we will work with another popular technical indicator: Average True Range (ATR).
In this article, we will continue our series about designing a trading system using the most popular indicators and we will talk about the average directional index (ADX) indicator. We will learn this indicator in detail to understand it well and we will learn how we to use it through a simple strategy. By learning something deeply we can get more insights and we can use it better.
In this article, we continue our learning series — this time we will learn how to design a trading system using one of the most popular and useful indicators, which is the Stochastic Oscillator indicator, to build a new block in our knowledge of basics.
In this article, we will learn a new tool from our series: we will learn how to design a trading system based on one of the most popular technical indicators Moving Average Convergence Divergence (MACD).