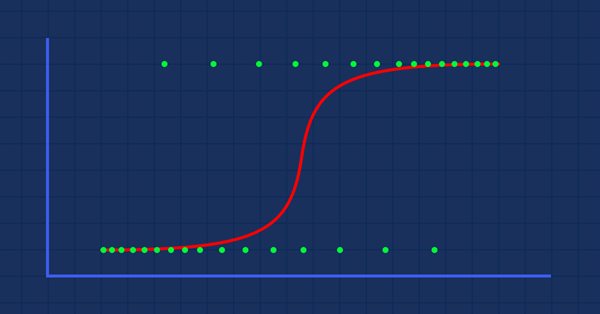
Data Classification is a crucial thing for an algo trader and a programmer. In this article, we are going to focus on one of classification logistic algorithms that can probability help us identify the Yes's or No's, the Ups and Downs, Buys and Sells.
In this new article from our series for learning how to design trading systems, I will present the Commodities Channel Index (CCI), explain its specifics, and share with you how to create a trading system based on this indicator.
In my previous article, I mentioned the importance of identifying the trend which is the direction of prices. In this article I will share one of the most important concepts and indicators which is the Momentum indicator. I will share how to design a trading system based on this Momentum indicator.
In this article, I will share with you one of the most popular and commonly used indicators in the world of trading which is RSI. You will learn how to design a trading system using this indicator.
In this article, I will share with you one of the methods of how to trade bands. This time we will consider Envelopes and will see how easy it is to create some strategies based on the Envelopes.
In this article, we will discuss how to develop a trading robot with minimum programming. Of course, MetaTrader 5 provides a high level of control over trading positions. However, using only the manual ability to place orders can be quite difficult and risky for less experienced users.
This article presents an analysis of currency data to better understand why expert advisors can have good performance in some regions of time and poor performance in other regions of time.
In this article, we will learn about Bollinger Bands which is one of the most popular indicators in the trading world. We will consider technical analysis and see how to design an algorithmic trading system based on the Bollinger Bands indicator.
By using special data types 'matrix' and 'vector', it is possible to create code which is very close to mathematical notation. With these methods, you can avoid the need to create nested loops or to mind correct indexing of arrays in calculations. Therefore, the use of matrix and vector methods increases the reliability and speed in developing complex programs.
There are many strategies that can be used to filter generated signals based on any strategy, even by using the moving average itself which is the subject of this article. So, the objective of this article is to share with you some of Moving Average Strategies and how to design an algorithmic trading system.
In this article, we demonstrate features of botbrains.app - a no-code platform for trading robots development. To create a trading robot you don't need to write any code - just drag and drop the necessary blocks onto the scheme, set their parameters, and establish connections between them.
This article shows the basics of MQL for beginners to design their Algorithmic trading system (Expert Advisor) through designing a simple algorithmic trading system after mentioning some basics of MQL5
Stop-loss is a major tool when it comes to money management in trading. Effective use of stop-loss, take profit and lot size can make a trader more consistent in trading and overall more profitable. Although stop-loss is a great tool, there are challenges that are encountered when being used. The major one being stop-loss hunt. This article looks on how to reduce stop-loss hunt in trade and compare with the classical stop-loss usage to determine its profitability.
Functions and code snippets that simplify and clarify the handling of time, broker offset, and the changes to summer or winter time. Accurate timing may be a crucial element in trading. At the current hour, is the stock exchange in London or New York already open or not yet open, when does the trading time for Forex trading start and end? For a trader who trades manually and live, this is not a big problem.
This is the first article in a series related to reversal patterns in the framework of algorithmic trading. We will begin with the most interesting pattern family, which originate from the Double Top and Double Bottom patterns.
This is the must read article for anyone wanting to improve their programming career. This article series is aimed at making you the best programmer you can possibly be, no matter how experienced you are. The discussed ideas work for MQL5 programming newbies as well as professionals.
In this article, I will describe the concept of building various library GUI design themes, create the Form object, which is a descendant of the graphical element class object, and prepare data for creating shadows of the library graphical objects, as well as for further development of the functionality.
In this article, I will continue the development of the basic graphical element class of all library graphical objects powered by the CCanvas Standard Library class. I will create the methods for drawing graphical primitives and for displaying a text on a graphical element object.
In this article, I will rework the concept of building graphical objects from the previous article and prepare the base class of all graphical objects of the library powered by the Standard Library CCanvas class.
The article opens up a new large section of the library for working with graphics. In the current article, I will create the mouse status object, the base object of all graphical elements and the class of the form object of the library graphical elements.
In this article, I will complete working with chart object classes and their collection. I will also implement auto tracking of changes in chart properties and their windows, as well as saving new parameters to the object properties. Such a revision allows the future implementation of an event functionality for the entire chart collection.
In this article, I will create the functionality for tracking some chart object events — adding/removing symbol charts and chart subwindows, as well as adding/removing/changing indicators in chart windows.
In this article I will try to expand the classic concept of swap trading methods. I will explain why I have come to the conclusion that this concept deserves special attention and is absolutely recommended for study.
With this article, I start the development of the chart object collection class. The class will store the collection list of chart objects with their subwindows and indicators providing the ability to work with any selected charts and their subwindows or with a list of several charts at once.
In this article, I will continue the development of the chart object class. I will add the list of chart window objects featuring the lists of available indicators.
In the previous article, we started considering methods aimed at improving neural network training quality. In this article, we will continue this topic and will consider another approach — batch data normalization.
In this article, I will create the chart object class (of a single trading instrument chart) and improve the collection class of MQL5 signal objects so that each signal object stored in the collection updates all its parameters when updating the list.
In this article, I will create the signal collection class of the MQL5.com Signals service with the functions for managing signals. Besides, I will improve the Depth of Market snapshot object class for displaying the total DOM buy and sell volumes.
As the next step in studying neural networks, I suggest considering the methods of increasing convergence during neural network training. There are several such methods. In this article we will consider one of them entitled Dropout.
In this article, I will create two classes (the class of DOM snapshot object and the class of DOM snapshot series object) and test creation of the DOM data series.
I continue filling the algorithm with the minimum necessary functionality and testing the results. The profitability is quite low but the articles demonstrate the model of the fully automated profitable trading on completely different instruments traded on fundamentally different markets.
In this article I will demonstrate some very interesting and useful techniques for automated trading. Some of them may be familiar to you. I will try to cover the most interesting methods and will explain why they are worth using. Furthermore, I will show what these techniques are apt to in practice. We will create Expert Advisors and test all the described techniques using historic quotes.
Perhaps one of the most advanced models among currently existing language neural networks is GPT-3, the maximal variant of which contains 175 billion parameters. Of course, we are not going to create such a monster on our home PCs. However, we can view which architectural solutions can be used in our work and how we can benefit from them.
In this article, I will implement updating tick data in real time and prepare the symbol object class for working with Depth of Market (DOM itself is to be implemented in the next article).
It is impossible to get a truly stable algorithm if we use optimization based on historical data to select parameters. A stable algorithm should be aware of what parameters are needed when working on any trading instrument at any time. It should not forecast or guess, it should know for sure.
The use of computer vision allows training neural networks on the visual representation of the price chart and indicators. This method enables wider operations with the whole complex of technical indicators, since there is no need to feed them digitally into the neural network.
We have previously considered the mechanism of self-attention in neural networks. In practice, modern neural network architectures use several parallel self-attention threads to find various dependencies between the elements of a sequence. Let us consider the implementation of such an approach and evaluate its impact on the overall network performance.
In this article, I will continue the development of the topic by improving the flexibility of the previously created algorithm. The algorithm became more stable with an increase in the number of candles in the analysis window or with an increase in the threshold percentage of the overweight of falling or growing candles. I had to make a compromise and set a larger sample size for analysis or a larger percentage of the prevailing candle excess.