Now the creation occurs at the same point where we converted ticks into bars. This way, if something goes wrong during the conversion process, we will immediately notice the error. This is because the same code that places 1-minute bars on the chart during fast forwarding is also used for the positioning system to place bars during normal performance. In other words, the code that is responsible for this task is not duplicated anywhere else. This way we get a much better system for both maintenance and improvement.
Although this is the third article on this topic, I must explain for those who have not yet understood the difference between the stock market and the foreign exchange market: the big difference is that in the Forex there is no, or rather, we are not given information about some points that actually occurred during the course of trading.
We will continue to build a system for working in the FOREX market. In order to solve this problem, we must first declare the loading of ticks before loading the previous bars. This solves the problem, but at the same time forces the user to follow some structure in the configuration file, which, personally, does not make much sense to me. The reason is that by designing a program that is responsible for analyzing and executing what is in the configuration file, we can allow the user to declare the elements he needs in any order.
In this article, we will try to provide trading systems using a very important concept in the financial market which is volatility. We will provide a trading system based on the Keltner Channel indicator after understanding it and how we can code it and how we can create a trading system based on a simple trading strategy and then test it on different assets.
In this article, we will consider pair trading, namely what its principles are and if there are any prospects for its practical application. We will also try to create a pair trading strategy.
AdaBoost, a powerful boosting algorithm designed to elevate the performance of your AI models. AdaBoost, short for Adaptive Boosting, is a sophisticated ensemble learning technique that seamlessly integrates weak learners, enhancing their collective predictive strength.
The article takes a quick look at the ALGLIB 3.19 numerical analysis library, its applications and new algorithms that can improve the efficiency of financial data analysis.
The multi-currency expert advisor in this article is an expert advisor or trading robot that uses two RSI indicators with crossing lines, the Fast RSI which crosses with the Slow RSI.
In this article, we will learn how we can build an Aroon trading system after learning the basics of the indicators and the needed steps to build a trading system based on the Aroon indicator. After building this trading system, we will test it to see if it can be profitable or needs more optimization.
Embark on a compelling exploration where financial analysis meets algorithmic trading as we unravel the art of seamlessly uniting R and MetaTrader 5. This article is your guide to bridging the realms of analytical finesse in R with the formidable trading capabilities of MetaTrader 5.
Truncated Singular Value Decomposition (SVD) and Non-Negative Matrix Factorization (NMF) are dimensionality reduction techniques. They both play significant roles in shaping data-driven trading strategies. Discover the art of dimensionality reduction, unraveling insights, and optimizing quantitative analyses for an informed approach to navigating the intricacies of financial markets.
Embark on an illuminating journey with Part Two of our MQL5 series. These articles are not just tutorials, they're doorways to an enchanted realm where programming novices and wizards alike unite. What makes this journey truly magical? Part Two of our MQL5 series stands out with its refreshing simplicity, making complex concepts accessible to all. Engage with us interactively as we answer your questions, ensuring an enriching and personalized learning experience. Let's build a community where understanding MQL5 is an adventure for everyone. Welcome to the enchantment!
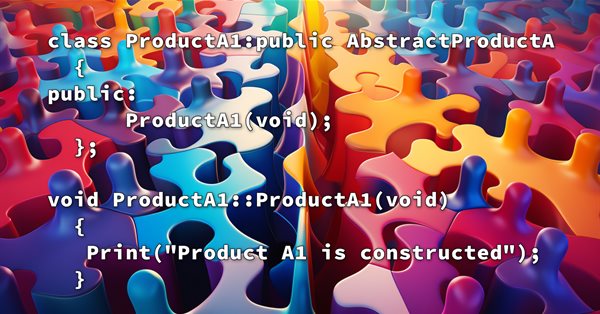
In this article, we will complete our series about the Design Patterns topic, we mentioned that there are three types of design patterns creational, structural, and behavioral. We will complete the remaining patterns of the behavioral type which can help set the method of interaction between objects in a way that makes our code clean.
Discover the secrets of algorithmic alchemy as we guide you through the blend of artistry and precision in decoding financial landscapes. Unearth how Random Forests transform data into predictive prowess, offering a unique perspective on navigating the complex terrain of stock markets. Join us on this journey into the heart of financial wizardry, where we demystify the role of Random Forests in shaping market destiny and unlocking the doors to lucrative opportunities
In this article I will show the first part of the improvements that allowed me not only to close the entire automation chain for MetaTrader 4 and 5 trading, but also to do something much more interesting. From now on, this solution allows me to fully automate both creating EAs and optimization, as well as to minimize labor costs for finding effective trading configurations.
The initial goal of this article is not to cover all the possibilities of Forex trading, but rather to adapt the system so that you can perform at least one market replay. We'll leave simulation for another moment. However, if we don't have ticks and only bars, with a little effort we can simulate possible trades that could happen in the Forex market. This will be the case until we look at how to adapt the simulator. An attempt to work with Forex data inside the system without modifying it leads to a range of errors.
Dive into the intricate world of decision trees in the latest installment of our Data Science and Machine Learning series. Tailored for traders seeking strategic insights, this article serves as a comprehensive recap, shedding light on the powerful role decision trees play in the analysis of market trends. Explore the roots and branches of these algorithmic trees, unlocking their potential to enhance your trading decisions. Join us for a refreshing perspective on decision trees and discover how they can be your allies in navigating the complexities of financial markets.
The Multi-Currency Expert Advisor in this article is an Expert Advisor or Trading Robot that can trade (open orders, close orders and manage orders for example: Trailing Stop Loss and Trailing Profit) for more than one symbol pair from only one symbol chart. In this article we will use signals from two indicators, in this case Bollinger Bands® on Keltner Channel.
Here we will prepare the ground so that if we need to add new functions to the code, this will happen smoothly and easily. The current code cannot yet cover or handle some of the things that will be necessary to make meaningful progress. We need everything to be structured in order to enable the implementation of certain things with the minimal effort. If we do everything correctly, we can get a truly universal system that can very easily adapt to any situation that needs to be handled.
A new article from Design Patterns articles and we will take a look at one of its types which is behavioral patterns to understand how we can build communication methods between created objects effectively. By completing these Behavior patterns we will be able to understand how we can create and build a reusable, extendable, tested software.
This series of articles introduces several time series labeling methods, which can create data that meets most artificial intelligence models, and targeted data labeling according to needs can make the trained artificial intelligence model more in line with the expected design, improve the accuracy of our model, and even help the model make a qualitative leap!
In this article, we will analyse the impact of dividend announcements on stock market returns and see how investors can earn more returns than those offered by the market when they expect a company to announce dividends. In doing so, we will also check the validity of the Efficient Market Hypothesis in the context of the Indian Stock Market.
We need to organize our work better. The code is growing, and if this is not done now, then it will become impossible. Let's divide and conquer. MQL5 allows the use of classes which will assist in implementing this task, but for this we need to have some knowledge about classes. Probably the thing that confuses beginners the most is inheritance. In this article, we will look at how to use these mechanisms in a practical and simple way.
In this article we will complete the development of a simulator for our system. The main goal here will be to configure the algorithm discussed in the previous article. This algorithm aims to create a RANDOM WALK movement. Therefore, to understand today's material, it is necessary to understand the content of previous articles. If you have not followed the development of the simulator, I advise you to read this sequence from the very beginning. Otherwise, you may get confused about what will be explained here.
In this article we will continue the simulator development stage. this time we will see how to effectively create a RANDOM WALK type movement. This type of movement is very intriguing because it forms the basis of everything that happens in the capital market. In addition, we will begin to understand some concepts that are fundamental to those conducting market analysis.
The Multi-Currency Expert Advisor in this article is Expert Advisor or trading robot that can trade (open orders, close orders and manage orders for example: Trailing Stop Loss and Trailing Profit) for more than one symbol pair only from one symbol chart. This time we will use only 1 indicator, namely Triangular moving average in multi-timeframes or single timeframe.
In this article, we will continue our articles about Design Patterns after learning how much this topic is more important for us as developers to develop extendable, reliable applications not only by the MQL5 programming language but others as well. We will learn about another type of Design Patterns which is the structural one to learn how to design systems by using what we have as classes to form larger structures.
Here we will simplify a few elements related to the work in the next article. I'll also explain how you can visualize what the simulator generates in terms of randomness.
In this article, I will show a completely different approach to algorithmic trading I ended up with after quite a long time. Of course, all this has to do with my brute force program, which has undergone a number of changes that allow it to solve several problems simultaneously. Nevertheless, the article has turned out to be more general and as simple as possible, which is why it is also suitable for those who know nothing about brute force.
Within the framework of the engineering approach developed by the author based on the probability theory, the conditions for opening a profitable position are found and the optimal (profit-maximizing) take profit and stop loss values are calculated.
Developing a simulator can be much more interesting than it seems. Today we'll take a few more steps in this direction because things are getting more interesting.
In order to use the data that forms the bars, we must abandon replay and start developing a simulator. We will use 1 minute bars because they offer the least amount of difficulty.
Several fellow traders sent emails or commented about how to use this Multi-Currency EA on brokers with symbol names that have prefixes and/or suffixes, and also how to implement trading time zones or trading time sessions on this Multi-Currency EA.
There are methods that can be used to solve many problems that can be repeated. Once understand how to use these methods it can be very helpful to create your software effectively and apply the concept of DRY ((Do not Repeat Yourself). In this context, the topic of Design Patterns will serve very well because they are patterns that provide solutions to well-described and repeated problems.
With the rapid development of artificial intelligence today, language models (LLMs) are an important part of artificial intelligence, so we should think about how to integrate powerful LLMs into our algorithmic trading. For most people, it is difficult to fine-tune these powerful models according to their needs, deploy them locally, and then apply them to algorithmic trading. This series of articles will take a step-by-step approach to achieve this goal.
In this article, we will consider one of the methods of spectral analysis and signal processing - the discrete Hartley transform. It allows filtering signals, analyzing their spectrum and much more. The capabilities of DHT are no less than those of the discrete Fourier transform. However, unlike DFT, DHT uses only real numbers, which makes it more convenient for implementation in practice, and the results of its application are more visual.
With the rapid development of artificial intelligence today, language models (LLMs) are an important part of artificial intelligence, so we should think about how to integrate powerful LLMs into our algorithmic trading. For most people, it is difficult to fine-tune these powerful models according to their needs, deploy them locally, and then apply them to algorithmic trading. This series of articles will take a step-by-step approach to achieve this goal.
A new article about a new important topic which is dealing with date and time. As traders or programmers of trading tools, it is very crucial to understand how to deal with these two aspects date and time very well and effectively. So, I will share some important information about how we can deal with date and time to create effective trading tools smoothly and simply without any complicity as much as I can.
In the previous article, we made some fixes and added tests to our replication system to ensure the best possible stability. We also started creating and using a configuration file for this system.
When creating any trading system, there is a task we need to deal with effectively. This task is order placement or to let the created trading system deal with orders automatically because it is crucial in any trading system. So, you will find in this article most of the topics that you need to understand about this task to create your trading system in terms of order placement effectively.