The article outlines a practical data pipeline for quantitative analysis based on Parquet storage, Hive-style partitions, and DuckDB. It details migrating selected SQLite tables to Parquet, structuring market data by source, symbol, timeframe, and date, and querying it with SQL window functions. A Golden Cross example illustrates cross‑symbol evaluation of forward returns. Accompanying Python scripts handle data download, conversion, and execution.
This article explains why standard walkforward and k-fold CV inflate results on financial data, then shows how to fix it. V-in-V enforces strict data partitions and anchored walkforward across windows, CPCV purges and embargoes leakage while aggregating path-wise performance, and CSCV measures the Probability of Backtest Overfitting. Practitioners gain a coherent framework to assess regime robustness and selection reliability.
This article applies Depth-First Search to market structure by modeling swing highs and lows as graph nodes and tracking one structural path as deeply as conditions remain valid. When a key swing is broken, the algorithm backtracks and explores an alternative branch. Readers gain a practical framework to formalize structural bias and test whether the current path aligns with targets like liquidity pools or supply and demand zones.
This article details an MQL5 framework that restricts trading to an approved set of symbols. The solution combines a shared library, a configuration dashboard, and an enforcement Expert Advisor that validates each trade against a whitelist and logs blocked attempts. It includes fully functional code examples, a clear explanation of the structural design decisions, and validation tests that confirm reliable symbol filtering, controlled market exposure, and transparent monitoring of rule enforcement.
In this article, we advance the binomial distribution graphing tool in MQL5 by integrating DirectX for 3D visualization, enabling switchable 2D/3D modes with camera-controlled rotation, zoom, and auto-fitting for immersive analysis. We render 3D histogram bars, ground planes, and axes alongside the theoretical probability mass function curve, while preserving 2D elements like statistics panels, legends, and customizable themes, gradients, and labels
This article implements a box‑constrained Truncated Newton Conjugate‑Gradient (TNC) optimizer in MQL5 and details its core components: scaling, projection to bounds, line search, and Hessian‑vector products via finite differences. It provides an objective wrapper supporting analytic or numerical derivatives and validates the solver on the Rosenbrock benchmark. A logistic regression example shows how to use TNC as a drop‑in alternative to LBFGS.
This is an article about a specialized trend-following EA that aims to clearly elaborate how to frame and utilize trading setups that occur from imbalances found in PD arrays. This article will explore in detail an EA that is specifically designed for traders who are keen on optimizing and utilizing PD arrays and imbalances as entry criteria for their trades and trading decisions. It will also explore how to correctly determine and profile premium and discount arrays and how to validate and utilize each of them when they occur in their respective market conditions, thus trying to maximize opportunities that occur from such scenarios.
For maximum reliability and productivity in MetaTrader products built with MQL, this article advocates a development approach based on reusable “packages” managed by KnitPkg, a project manager for MQL5/MQL4. A package can be used as a building block for other packages or as the foundation for final artifacts that run directly on the MetaTrader platform, such as EAs, indicators, and more.
This article develops an interactive MQL5 plot for the binomial distribution, combining a histogram of simulated outcomes with the theoretical probability mass function. It implements mean, standard deviation, skewness, kurtosis, percentiles, and confidence intervals, along with configurable themes and labels, and supports dragging, resizing, and live parameter changes. Use it to assess expected wins, likely drawdowns, and confidence ranges when validating trading strategies.
We have developed a system that enforces a daily trade limit to keep you aligned with your trading rules. It monitors all executed trades across the account and automatically intervenes once the defined limit is reached, preventing any further activity. By embedding control directly into the platform, the system ensures discipline is maintained even when market pressure rises.
The article builds a transparent MQL5 Expert Advisor for Larry Williams’ hidden smash day reversals. Signals are generated only on new bars: a setup bar is validated, then confirmed when the next session trades beyond its extreme. Risk is managed via ATR or structural stops with a defined risk-to-reward, position sizing can be fixed or balance-based, and direction filters plus a one-position policy ensure reproducible tests.
We continue to integrate methods proposed by the authors of the Attraos framework into trading models. Let me remind you that this framework uses concepts of chaos theory to solve time series forecasting problems, interpreting them as projections of multidimensional chaotic dynamic systems.
During sideways price movements, traders face excessive signals from multiple moving average crossovers. Today, we discuss how ALGLIB preprocesses raw price data to produce filtered crossover layers, which can also generate alerts when they occur. Join this discussion to learn how a mathematical library can be leveraged in MQL5 programs.
In this part, we will integrate a real-time correlation matrix into a multi-symbol Expert Advisor to prevent redundant or risk-stacked trades. By dynamically measuring cross-pair relationships, the EA will filter entries that conflict with existing exposure, improving portfolio balance, reducing systemic risk, and enhancing overall trade quality.
The Attraos framework integrates chaos theory into long-term time series forecasting, treating them as projections of multidimensional chaotic dynamic systems. Exploiting attractor invariance, the model uses phase space reconstruction and dynamic multi-resolution memory to preserve historical structures.
In this part of the Price Action Analysis Toolkit Development series, we develop an MQL5 indicator that automatically detects rising and falling wedge patterns in real time. The system confirms pivot structures, validates boundary convergence mathematically, prevents overlapping formations, and monitors breakout and failure conditions with precise visual feedback. Built using a clean object-oriented architecture, this implementation converts subjective wedge recognition into a structured, state-aware analytical component designed to strengthen disciplined price action analysis.
Let's discuss how we can make our Expert Advisors speech‑capable using text‑to‑speech technology, partnering Python and MQL5. After reading this article, you will walk away with a working example of an EA that speaks dynamic market information. You will master the application of TTS, the WebRequest function, and learn how Python libraries integrate with the MQL5 language to create a truly voice‑aware trading tool.
In this article, we enhance the regression graphing tool in MQL5 by adding a cyberpunk theme mode with neon glows, animations, and holographic effects for immersive visualization. We integrate theme toggling, dynamic backgrounds with stars, glowing borders, and neon points/lines, while maintaining standard mode compatibility. This dual-theme system elevates pair analysis with futuristic aesthetics, supporting real-time updates and interactions for engaging trading insights.
This article presents an adaptive parallel channel detection and breakout system in MQL5. It explains how swing points are identified, channels are constructed and dynamically recalculated, and breakouts are confirmed and visualized with persistent signals. The framework integrates trendline geometry, ATR-based filtering, and retest validation to provide reliable, real-time price action analysis for professional charting and trading decisions.
The article shows how to pair SQLite (OLTP) with DuckDB (OLAP) for statistical arbitrage data processing. DuckDB’s columnar engine, ASOF JOIN, and array functions accelerate core tasks such as quote–trade alignment and RWEC, with measured speedups from 2x to 23x versus SQLite on larger inputs. You get simpler queries and faster analytics while keeping trade execution in SQLite.
This article shows how to build an MQL5 indicator that reads a CSV trading history, extracts Profit($) values and total trades, and computes a cumulative balance progression. We plot the curve in a separate indicator window, auto-scale the Y-axis, and draw horizontal and vertical axes for alignment. The indicator updates on a timer and redraws only when new trades appear. Optional labels display per-trade profit and loss to help assess performance and drawdowns directly on the chart.
Built on lower-timeframe market structure, and then orchestrated on the higher-timeframe, this indicator detects swing extremes where price becomes statistically vulnerable to reversal. It visualizes overextension and pullback zones, offering early insight into mean-reversion behavior.
This article discusses the application of a breakeven mechanism in automated strategies using the MQL5 language. We will start with a simple explanation of what the breakeven mode is, how it is implemented, and its possible variations. Next, this functionality will be integrated into the Order Blocks expert advisor, which we created in our last article on risk management. To evaluate its effectiveness, we will run two backtests under specific conditions: one using the breakeven mechanism and the other without it.
This article shows how to automate Larry Williams Smash Day reversal patterns in MQL5 within a structured context. We implement an Expert Advisor that validates setups over a limited window, aligns entries with Supertrend-based trend direction and day-of-week filters, and supports entry on level cross or bar close. The code enforces one position at a time and risk-based or fixed sizing. Step-by-step development, backtesting procedure, and reproducible settings are provided.
The article extends a liquidity-based strategy with a simple trend constraint: trade liquidity zones only in the direction of the EMA(50). It explains filtering rules, presents a reusable TrendFilter.mqh class and EA integration in MQL5, and compares baseline versus filtered tests. Readers gain a clear directional bias, reduced overtrading in countertrend phases, and ready-to-use source files.
In this discussion we will Automate Swing Extremes and the Pullback Indicator, which transforms raw lower-timeframe (LTF) price action into a structured map of market intent, precisely identifying swing highs, swing lows, and corrective phases in real time. By programmatically tracking microstructure shifts, it anticipates potential reversals before they fully unfold—turning noise into actionable insight.
In this article, we enhance the hybrid Time Price Opportunity (TPO) market profile indicator in MQL5 by integrating volume data to calculate volume-based point of control, value areas, and volume-weighted average price with customizable highlighting options. The system introduces advanced features like initial balance detection, key level extension lines, split profiles, and alternative TPO characters such as squares or circles for improved visual analysis across multiple timeframes.
In this article, we create a canvas-based graphing tool in MQL5 for statistical correlation and linear regression analysis between two symbols, with draggable and resizable features. We incorporate ALGLIB for regression calculations, dynamic tick labels, data points, and a stats panel displaying slope, intercept, correlation, and R-squared. This interactive visualization aids in pair trading insights, supporting customizable themes, borders, and real-time updates on new bars
In the latest installment of this series, we move beyond individual machine learning techniques to address the "Research Chaos" that plagues many quantitative traders. This article focuses on the transition from ad-hoc notebook experiments to a principled, production-grade pipeline that ensures reproducibility, traceability, and efficiency.
Discipline becomes reliable when it is produced by system design, not willpower. Using MQL5, the article implements real-time constraints—trade-frequency caps and daily equity-based stops—that monitor behavior and trigger actions on breach. Readers gain a practical template for governance layers that stabilize execution under market pressure.
We translate the EMA‑50 retest idea into a behavior‑driven Expert Advisor for intraday trading. The study formalizes trend bias, EMA interaction (pierce and close), reaction confirmation, and optional filters, then implements them in MQL5 with modular functions and resource‑safe handles. Visual testing in the Strategy Tester verifies signal correctness. The result is a clear template for coding discretionary bounces.
We are close to completing this challenge. However, before we begin, I want you to try to understand these two articles—this one and the previous one. That way, you will truly understand the next article, in which I will cover exclusively the part related to MQL5 programming. But I will also try to make it understandable. If you do not understand these last two articles, it will be difficult for you to understand the next one, because the material accumulates. The more things there are to do, the more you need to create and understand in order to achieve the goal.
In this article, we develop a custom indicator in MQL5 for hybrid Time Price Opportunity (TPO) market profiles, supporting multiple session timeframes such as intraday, daily, weekly, monthly, and fixed periods with timezone adjustments. The indicator quantizes prices into a grid, tracks session data including highs, lows, opens, and closes, and calculates key elements like the point of control and value area based on TPO counts. It renders profiles visually on the chart with customizable colors for TPO letters, single prints, value areas, POC, and close markers, enabling detailed session analysis
In this article, we build an interactive tools palette in MQL5 for chart drawing, with draggable, resizable panels and theme switching. We add buttons for tools like crosshair, trendlines, lines, rectangles, Fibonacci, text, and arrows, handling mouse events for activation and instructions. This system improves trading analysis through a customizable UI, supporting real-time interactions on charts
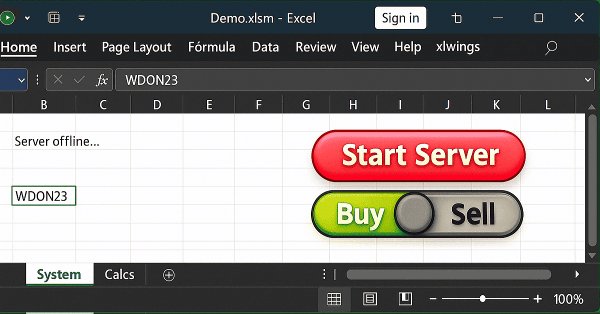
In this article, we will discuss one of the possible solutions to what we have been trying to demonstrate—namely, how to allow an Excel user to perform an action in MetaTrader 5 without sending orders or opening or closing positions. The idea is that the user employs Excel to conduct fundamental analysis of a particular symbol. And by using only Excel, they can instruct an expert advisor running in MetaTrader 5 to open or close a specific position.
Learn how to read a CSV file in MQL5 and organize its trading data into dynamic arrays. This article shows step by step how to count file elements, store all data in a single array, and separate each column into dedicated arrays, laying the foundation for advanced analysis and trading performance visualization.
When we develop something in xlwings or any other package that allows reading and writing directly to Excel, we must note that all programs, functions, or procedures execute and then complete their task. They do not remain in a loop, no matter how hard we try to do things differently.
We build a calendar‑driven news filter entirely in MQL5, avoiding web requests and external DLLs. Part 1 covers loading and caching events, mapping them to symbols by currency, filtering by impact level, defining pre/post windows, and blocking new trades during active news, with optional pre‑news position closure. The result is a configurable, prop‑firm‑friendly control that reduces false pauses and protects entries during volatility.
In this article, we will look at how to solve certain problems and issues that arise when using Python code within other programs. More specifically, we will demonstrate a common issue encountered when using Excel in conjunction with MetaTrader 5, although we will be using Python to facilitate this interaction. However, this implementation has a minor drawback. It does not occur in all cases, but only in certain specific situations. When it does happen, it is necessary to understand the cause. In today’s article, we will begin explaining how to resolve this issue.
In this article, we will implement the risk management system developed in previous publications and add the Order Blocks indicator described in other articles. In addition, we will run a backtest so we can compare results with the risk management system enabled and evaluate the impact of dynamic risk.