Build a non‑repainting Supertrend in MQL5 for MetaTrader 5 from first principles. We use an iATR handle and CopyBuffer for volatility, bind buffers with SetIndexBuffer, and configure plots (DRAWCOLORCANDLES plus two line bands) via PlotIndexSetInteger. The logic updates only on closed bars with EMPTY_VALUE to suppress inactive bands, exposing atrPeriod and atrMultiplier inputs. You get a clean, EA‑ready overlay with documented buffers for strategies and signals.
We are creating an adaptive self-learning trading expert advisor based on DQN machine learning, with multidimensional causal inference. The EA will successfully trade simultaneously on 7 currency pairs. And agents of different pairs will exchange information with each other.
Liquidity zones are commonly traded by waiting for the price to return and retest the zone of interest, often through the placement of pending orders within these areas. In this article, we leverage MQL5 to bring this concept to life, demonstrating how such zones can be identified programmatically and how risk management can be systematically applied. Join the discussion as we explore both the logic behind liquidity-based trading and its practical implementation.
Building on the previous article that introduced the market state classification module, this installment focuses on implementing the core logic for identifying and evaluating compression zones. It presents a range contraction detection and maturity grading system in MQL5 that analyzes market congestion using price action alone.
Create a practical bridge between MetaTrader 5 and Binance: fetch 30‑minute klines with WebRequest, extract OHLC/time values from JSON, and confirm a bullish engulfing pattern using only completed candles. Then assemble the query string, compute the HMAC‑SHA256 signature, add X‑MBX‑APIKEY, and submit authenticated orders. You get a clear, end‑to‑end EA workflow from data acquisition to order execution.
Do you want to know how to benefit from the difference in interest rates? This article considers how to use swap arbitrage in Forex to earn stable profit every night, creating a portfolio that is resistant to market fluctuations.
The extent of liquidity zones and the magnitude of the breakout range are key variables that substantially affect the probability of a retest occurring. In this discussion, we outline the complete process for developing an indicator that incorporates these ratios.
In this article, we enhance the MQL5 canvas dashboard with advanced visual effects, including blur gradients for fog overlays, shadow rendering for headers, and antialiased drawing for smoother lines and curves. We add smooth mouse wheel scrolling to the text panel that does not interfere with the chart zoom scale, technically an upgrade.
An empirical study of Larry Williams' short-term trading patterns, showing how classic setups can be automated in MQL5, tested on real market data, and evaluated for consistency, profitability, and practical trading value.
In this article, we write an example of visualizing the optimization process and display the top three passes for the four optimization criteria. We will also provide an opportunity to select one of the three best passes for displaying its data in tables and on a chart.
This article presents a structured way to manage SQLite data in MQL5 through an ORM layer for MetaTrader 5. It introduces core classes for entity modeling and database access, a fluent CRUD API, reflection hooks for OnGet/OnSet, and macros to define models quickly. Practical code shows creating tables, binding fields, inserting, updating, querying, and deleting records. Developers gain reusable, type-safe components that minimize repetitive SQL.
Today, we uncover the often overlooked statistical foundation behind supply and demand trading strategies. By combining MQL5 with Python through a Jupyter Notebook workflow, we conduct a structured, data-driven investigation aimed at transforming visual market assumptions into measurable insights. This article covers the complete research process, including data collection, Python-based statistical analysis, algorithm design, testing, and final conclusions. To explore the methodology and findings in detail, read the full article.
In this article, we'll look at what you need to do to start using Excel to manage MetaTrader 5, but in a very interesting way. To do this, we will use an Excel add-in to avoid using built-in VBA. If you don't know what add-in is meant, read this article and learn how to program in Python directly in Excel.
Breadth First Search (BFS) uses level-order traversal to model market structure as a directed graph of price swings evolving through time. By analyzing historical bars or sessions layer by layer, BFS prioritizes recent price behavior while still respecting deeper market memory.
The new proprietary optimization algorithm NOA2 (Neuroboids Optimization Algorithm 2) combines the principles of swarm intelligence with neural control. NOA2 combines the mechanics of a neuroboid swarm with an adaptive neural system that allows agents to self-correct their behavior while searching for the optimum. The algorithm is under active development and demonstrates potential for solving complex optimization problems.
In this part, we will focus on designing an intelligent execution layer that continuously monitors and evaluates real-time spread conditions across multiple symbols. The EA dynamically adapts its symbol selection by enabling or disabling trading based on spread efficiency rather than fixed rules. This approach allows high-frequency multi-pair systems to prioritize cost-effective symbols.
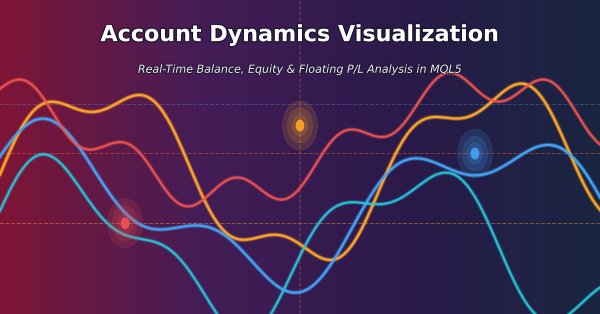
Create a custom MT5 indicator that processes the entire deal history and plots starting balance, balance, equity, and floating P/L as continuous curves. It updates per bar, aggregates positions across symbols, and avoids external dependencies through local caching. Use it to inspect equity–balance divergence, realized vs. unrealized results, and the timing of risk deployment.
We continue exploring hybrid graph sequence models (GSM++), which integrate the advantages of different architectures, providing high analysis accuracy and efficient distribution of computing resources. These models effectively identify hidden patterns, reducing the impact of market noise and improving forecasting quality.
Wave analysis is one of the methods used in technical analysis. This article focuses on two less conventional wave patterns: triangular and sawtooth waves. These formations underpin a number of technical indicators designed for market price analysis.
In this article, we develop a Nick Rypock Trailing Reverse (NRTR) trading system in MQL5 that uses channel indicators for reversal signals, enabling trend-following entries with hedging support for buys and sells. We incorporate risk management features like auto lot sizing based on equity or balance, fixed or dynamic stop-loss and take-profit levels using ATR multipliers, and position limits.
This article develops a market state classification module for MQL5 that interprets price behavior using completed price data. By examining volatility contraction, expansion, and structural consistency, the tool classifies market conditions as compression, transition, expansion, or trend, providing a clear contextual framework for price action analysis.
In this article, we enhance the canvas-based price dashboard in MQL5 by adding a pixel-perfect scrollable text panel for usage guides, overcoming native scrolling limitations through custom antialiasing and a rounded scrollbar design with hover-expand functionality. The text panel supports themed backgrounds with opacity, dynamic line wrapping for content like instructions and contacts, and interactive navigation via up/down buttons, slider dragging, and mouse wheel scrolling within the body area.
An in-depth walkthrough of building a Larry Williams inspired volatility breakout Expert Advisor in MQL5, combining swing structure, volatility-based entries, trade day of the week filtering, time filters, and flexible risk management, with a complete implementation and reproducible test setup.
In this article, we build a versatile RSI indicator in MQL5 supporting multiple variants, data sources, and smoothing methods for improved analysis. We add hue shifts for color visuals, dynamic boundaries for overbought/oversold zones, and notifications for trend alerts. It includes multi-timeframe support with interpolation, offering us a customizable RSI tool for diverse strategies.
In this article, we show how to send authenticated requests to the Binance API using MQL5 to retrieve your account balance for all assets. Learn how to use your API key, server time, and signature to securely access account data, and how to save the response to a file for future use.
In this discussion, we follow up on the previously developed multi-signal Expert Advisor with the objective of exploring and applying available optimization methods. The aim is to determine whether the trading performance of the EA can be meaningfully improved through systematic optimization based on historical data.
From ChatGPT to Gemini and many model AI tools for text, image, and video generation. Transformers have rocked the AI-world. But, are they applicable in the financial (trading) space? Let's find out.
In this article, we develop a canvas-based price dashboard in MQL5 using the CCanvas class to create interactive panels for visualizing recent price graphs and account statistics, with support for background images, fog effects, and gradient fills. The system includes draggable and resizable features via mouse event handling, theme toggling between dark and light modes with dynamic color adjustments, and minimize/maximize controls for efficient chart space management.
In this article, we will begin creating a core risk management class that will be key to controlling risks in the system. We will focus on building the foundations, defining the basic structures, variables and functions. In addition, we will implement the necessary methods for setting maximum profit and loss values, thereby laying the foundation for risk management.
This article presents a session-based analytical framework that combines time-defined market sessions with the Candle Pressure Index (CPI) to classify acceptance and rejection behavior at session boundaries using closed-candle data and clearly defined rules.
An empirical study of Larry Williams’ Trade Day of the Week concept, showing how time-based market bias can be measured, tested, and applied using MQL5. This article presents a practical framework for analyzing win rates and performance across trading days to improve short-term trading systems.
This study introduces a novel methodology for the development of trend-following trading strategies. This section describes the process of annotating training data and using it to train classifiers. This process yields fully operational trading systems designed to run on MetaTrader 5.
Hybrid graph sequence models (GSM++) combine the advantages of different architectures to provide high-fidelity data analysis and optimized computational costs. These models adapt effectively to dynamic market data, improving the presentation and processing of financial information.
This article presents the Chow test for detecting structural breaks in pair relationships and the application of the Cumulative Sum of Squares - CUSUM - for structural breaks monitoring and early detection. The article uses the Nvidia/Intel partnership announcement and the US Gov foreign trade tariff announcement as examples of slope inversion and intercept shift, respectively. Python scripts for all the tests are provided.
In this discussion, we will develop an indicator to identify price zones created by strong market activity, such as impulsive moves, structure shifts, and liquidity events. These zones represent areas where the market has left “memory” due to unfilled orders or rapid price displacement. By marking these regions on the chart, the indicator highlights where price is statistically more likely to revisit and react in the future.
In this fascinating article, we build our very first trading robot in the simulator and run a strategy testing action that resembles how the MetaTrader 5 strategy tester works, then compare the outcome produced in a custom simulation against our favorite terminal.
This article presents the development of an arbitrage analysis panel in MQL5. How to get fair exchange rates on Forex in different ways? Create an indicator to obtain deviations of market prices from fair exchange rates, as well as to assess the benefits of arbitrage ways of exchanging one currency for another (as in triangular arbitrage).
The article presents the Central Force Optimization (CFO) algorithm inspired by the laws of gravity. It explores how principles of physical attraction can solve optimization problems where "heavier" solutions attract less successful counterparts.
This article introduces the basic concepts behind HMAC-SHA256 and API signatures in MQL5, explaining how messages and secret keys are combined to securely authenticate requests. It lays the foundation for signing API calls without exposing sensitive data.
In this article, we enhance the correlation matrix dashboard in MQL5 with interactive features like panel dragging, minimizing/maximizing, hover effects on buttons and timeframes, and mouse event handling for improved user experience. We add sorting of symbols by average correlation strength in ascending/descending modes, toggle between correlation and p-value views, and incorporate light/dark theme switching with dynamic color updates.