This article revisits the classic moving average crossover strategy and examines why it often fails in noisy, fast-moving markets. It presents five alternative filtering methods designed to strengthen signal quality and remove weak or unprofitable trades. The discussion highlights how statistical models can learn and correct the errors that human intuition and traditional rules miss. Readers leave with a clearer understanding of how to modernize an outdated strategy and of the pitfalls of relying solely on metrics like RMSE in financial modeling.
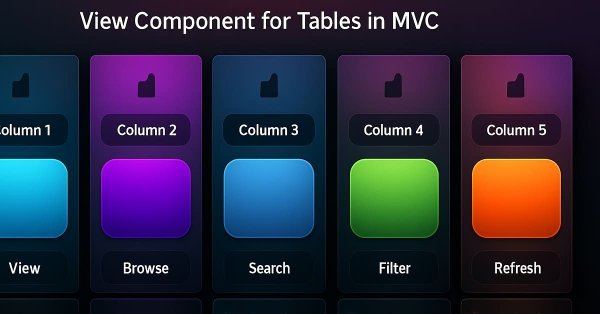
The article covers simple controls as components of more complex graphical elements of the View component within the framework of table implementation in the MVC (Model-View-Controller) paradigm. The basic functionality of the Controller is implemented for interaction of elements with the user and with each other. This is the second article on the View component and the fourth one in a series of articles on creating tables for the MetaTrader 5 client terminal.
In this article, we will try to understand why programming languages like MQL5 have structures, and why in some cases structures are the ideal way to pass values between functions and procedures, while in other cases they may not be the best way to do it.
In this session, we will build a sophisticated, multi-signal Expert Advisor using the MQL5 Standard Library. This approach allows us to seamlessly blend built-in signals with our own custom logic, demonstrating how to construct a powerful and flexible trading algorithm. For more, click to read further.
The article covers the process of developing a base graphical element for the View component as part of the implementation of tables in the MVC (Model-View-Controller) paradigm in MQL5. This is the first article on the View component and the third one in a series of articles on creating tables for the MetaTrader 5 client terminal.
Today, we use the MQL5 Standard Library to build custom signal classes and let the MQL5 Wizard assemble a professional Expert Advisor for us. This approach simplifies development so that even beginner programmers can create robust EAs without in-depth coding knowledge, focusing instead on tuning inputs and optimizing performance. Join this discussion as we explore the process step by step.
Today we will begin to study structures in a simpler, more practical, and comfortable way. Structures are among the foundations of programming, whether they are structured or not. I know many people think of structures as just collections of data, but I assure you that they are much more than just structures. And here we will begin to explore this new universe in the most didactic way.
Sockets. Do you know what they are for or how to use them in MetaTrader 5? If the answer is no, let's start by studying them. In today's article, we'll cover the basics. Since there are several ways to do the same thing, and we are always interested in the result, I want to show that there is indeed a simple way to transfer data from MetaTrader 5 to other programs, such as Excel. However, the main idea is not to transfer data from MetaTrader 5 to Excel, but the opposite, that is, to transfer data from Excel or any other program to MetaTrader 5.
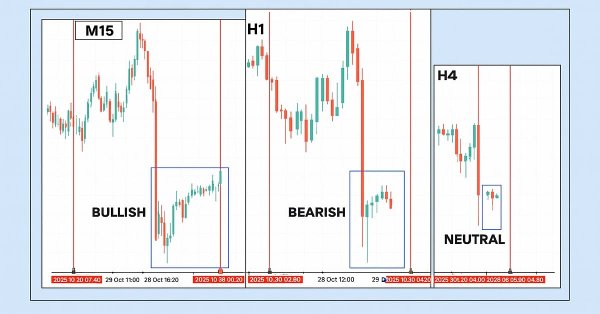
This article presents the Multi‑Timeframe Visual Analyzer, an MQL5 Expert Advisor that reconstructs and overlays higher‑timeframe candles directly onto your active chart. It explains the implementation, key inputs, and practical outcomes, supported by an animated demo and chart examples showing instant toggling, multi‑timeframe confirmation, and configurable alerts. Read on to see how this tool can make chart analysis faster, clearer, and more efficient.
This is the second part of the article devoted to the implementation of the table model in MQL5 using the MVC (Model-View-Controller) architectural paradigm. The article discusses the development of table classes and the table header based on a previously created table model. The developed classes will form the basis for further implementation of View and Controller components, which will be discussed in the following articles.
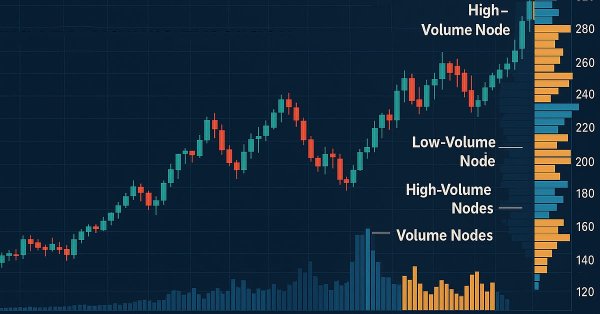
Analytical Volume Profile Trading (AVPT) explores how liquidity architecture and market memory shape price behavior, enabling more profound insight into institutional positioning and volume-driven structure. By mapping POC, HVNs, LVNs, and Value Areas, traders can identify acceptance, rejection, and imbalance zones with precision.
This article is intended for algorithmic traders, quantitative analysts, and MQL5 developers interested in enhancing their understanding of candlestick pattern recognition through practical implementation. It provides an in‑depth exploration of the CandlePatternSearch.mq5 Expert Advisor—a complete framework for detecting, visualizing, and monitoring classical candlestick formations in MetaTrader 5. Beyond a line‑by‑line review of the code, the article discusses architectural design, pattern detection logic, GUI integration, and alert mechanisms, illustrating how traditional price‑action analysis can be automated efficiently.
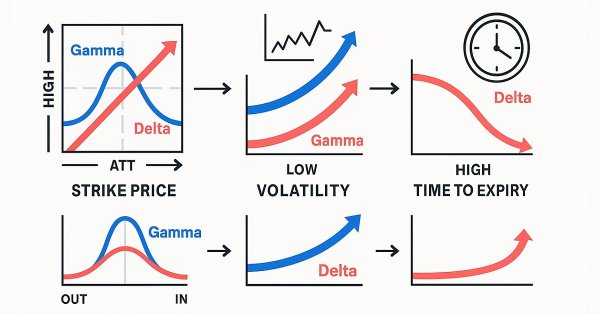
Gamma and Delta were originally developed as risk-management tools for hedging options exposure, but over time they evolved into powerful instruments for advanced scalping, order-flow modeling, and microstructure trading. Today, they serve as real-time indicators of price sensitivity and liquidity behavior, enabling traders to anticipate short-term volatility with remarkable precision.
This article demonstrates how to automatically identify potentially profitable trading strategies using MetaTrader 5. White-box solutions, powered by unsupervised matrix factorization, are faster to configure, more interpretable, and provide clear guidance on which strategies to retain. Black-box solutions, while more time-consuming, are better suited for complex market conditions that white-box approaches may not capture. Join us as we discuss how our trading strategies can help us carefully identify profitable strategies under any circumstance.
In this article, we will look at how to improve and more effectively apply the concepts presented in the previous article using the powerful MQL5 graphical control libraries. We'll go step by step through the process of creating a fully functional GUI. I'll be explaining the ideas behind it, as well as the purpose and operation of each method used. Additionally, at the end of the article, we will test the panel we created to ensure it functions correctly and meets its stated goals.
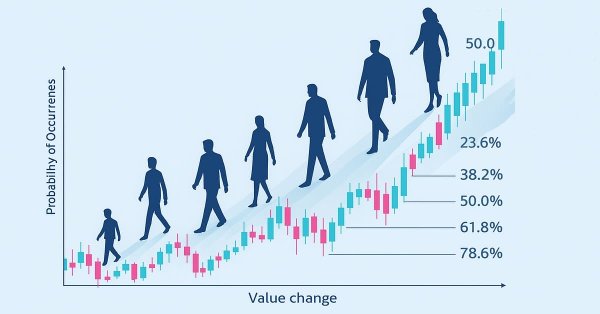
Fibonacci levels provide a practical framework that markets often respect, highlighting price zones where reactions are more likely. In this article, we build an expert advisor that applies Fibonacci retracement logic to anticipate likely future moves and trade retracements with pending orders. Explore the full workflow—from swing detection to level plotting, risk controls, and execution.
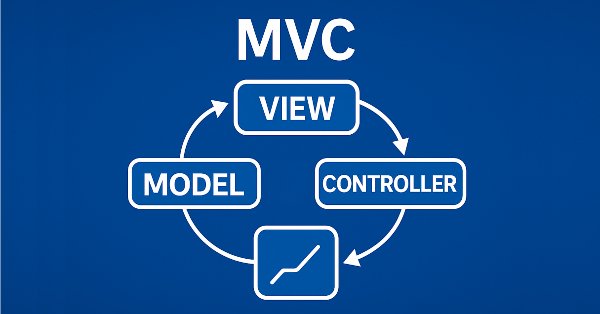
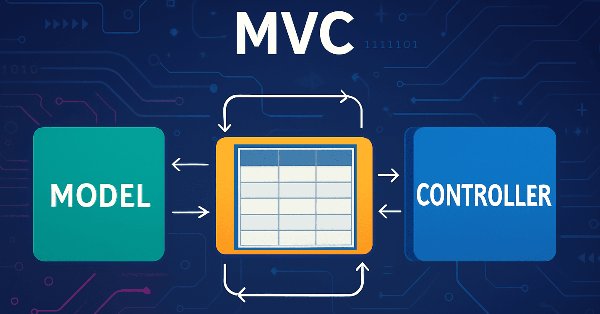
In this article, we look at the process of developing a table model in MQL5 using the MVC (Model-View-Controller) architectural pattern to separate data logic, presentation, and control, enabling structured, flexible, and scalable code. We consider implementation of classes for building a table model, including the use of linked lists for storing data.
Many traders struggle to identify genuine reversals. This article presents an EA that combines RVGI, CCI (±100), and an SMA trend filter to produce a single clear reversal signal. The EA includes an on-chart panel, configurable alerts, and the full source file for immediate download and testing.
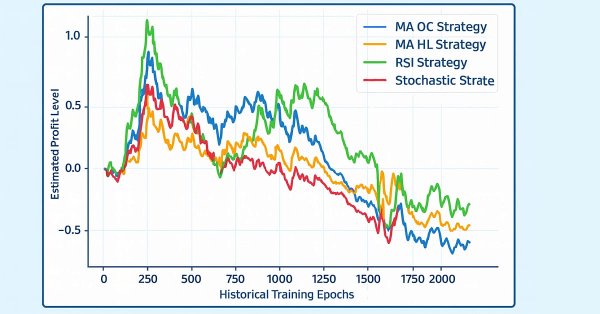
All algorithmic trading strategies are difficult to set up and maintain, regardless of complexity—a challenge shared by beginners and experts alike. This article introduces an ensemble framework where supervised models and human intuition work together to overcome their shared limitations. By aligning a moving average channel strategy with a Ridge Regression model on the same indicators, we achieve centralized control, faster self-correction, and profitability from otherwise unprofitable systems.
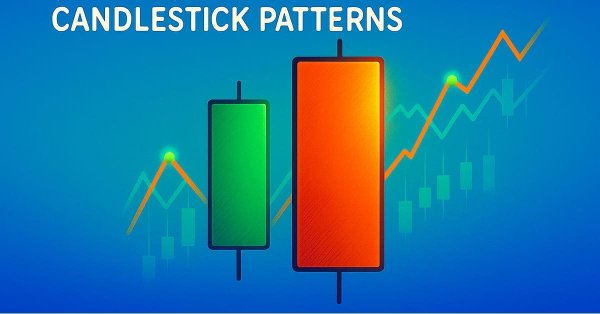
This article helps new community members search for and discover their own candlestick patterns. Describing these patterns can be daunting, as it requires manually searching and creatively identifying improvements. Here, we introduce the engulfing candlestick pattern and show how it can be enhanced for more profitable trading applications.
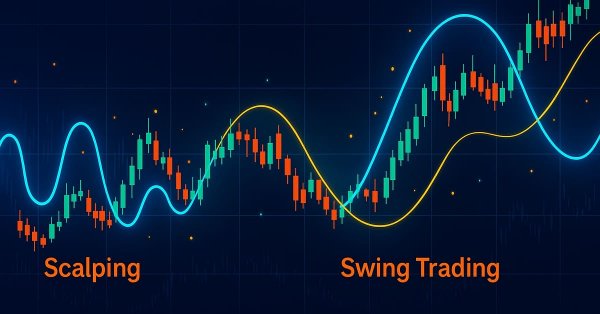
This part explores how to design a Dynamic Multi-Pair Expert Advisor capable of adapting between Scalping and Swing Trading modes. It covers the structural and algorithmic differences in signal generation, trade execution, and risk management, allowing the EA to intelligently switch strategies based on market behavior and user input.
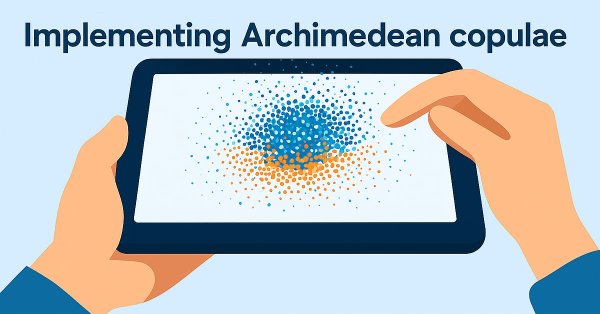
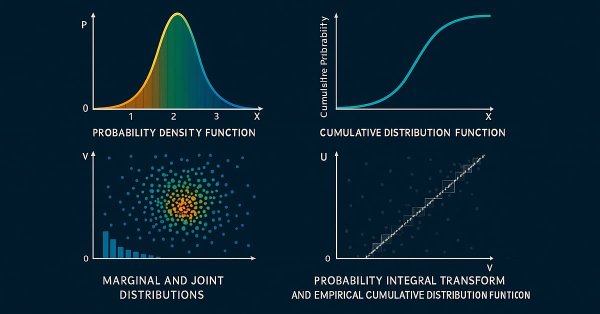
In the second installment of the series, we discuss the properties of bivariate Archimedean copulae and their implementation in MQL5. We also explore applying copulae to the development of a simple pairs trading strategy.
Simplify your MetaTrader 5 charts with the Multi Indicator Handler EA. This interactive dashboard merges trend, momentum, and volatility indicators into one real‑time panel. Switch instantly between profiles to focus on the analysis you need most. Declutter with one‑click Hide/Show controls and stay focused on price action. Read on to learn step‑by‑step how to build and customize it yourself in MQL5.
In this discussion, we focus on how we can break the glass ceiling imposed by classical machine learning techniques in finance. It appears that the greatest limitation to the value we can extract from statistical models does not lie in the models themselves — neither in the data nor in the complexity of the algorithms — but rather in the methodology we use to apply them. In other words, the true bottleneck may be how we employ the model, not the model’s intrinsic capability.
In this article, I will explain how Chart Trade, together with the Expert Advisor, will process a request to close all of the users' open positions. This may sound simple, but there are a few complications that you need to know how to manage.
In this discussion, we will develop an Expert Advisor using the CTrade and CChartObjectStdDevChannel classes, while applying several filters to enhance profitability. This stage puts our previous discussion into practical application. Additionally, I’ll introduce another simple approach to help you better understand the MQL5 Standard Library and its underlying codebase. Join the discussion to explore these concepts in action.
This article introduces the “Multi-Timeframe Harmony Index”—an advanced Expert Advisor for MetaTrader 5 that calculates a weighted bias from multiple timeframes, smooths the readings using EMA, and displays the results in a clean chart panel dashboard. It includes customizable alerts and automatic buy/sell signal plotting when strong bias thresholds are crossed. Suitable for traders who use multi-timeframe analysis to align entries with overall market structure.
Linear system identifcation may be coupled to learn to correct the error in a supervised learning algorithm. This allows us to build applications that depend on statistical modelling techniques without necessarily inheriting the fragility of the model's restrictive assumptions. Classical supervised learning algorithms have many needs that may be supplemented by pairing these models with a feedback controller that can correct the model to keep up with current market conditions.
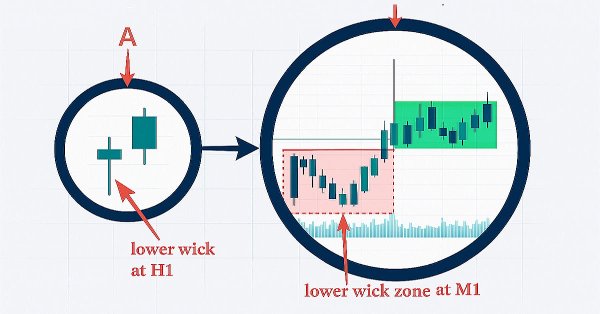
In this discussion, we take a step forward to uncover the underlying price action hidden within candlestick wicks. By integrating a wick visualization feature into the Market Periods Synchronizer, we enhance the tool with greater analytical depth and interactivity. This upgraded system allows traders to visualize higher-timeframe price rejections directly on lower-timeframe charts, revealing detailed structures that were once concealed within the shadows.
Gamma and Delta measure how an option’s value reacts to changes in the underlying asset’s price. Delta represents the rate of change of the option’s price relative to the underlying, while Gamma measures how Delta itself changes as price moves. Together, they describe an option’s directional sensitivity and convexity—critical for dynamic hedging and volatility-based trading strategies.
In this article, we'll explore one last simple use case for templates, and discuss the benefits and necessity of using typename in your code. Although this article may seem a bit complicated at first, it is important to understand it properly in order to use templates and typename later.
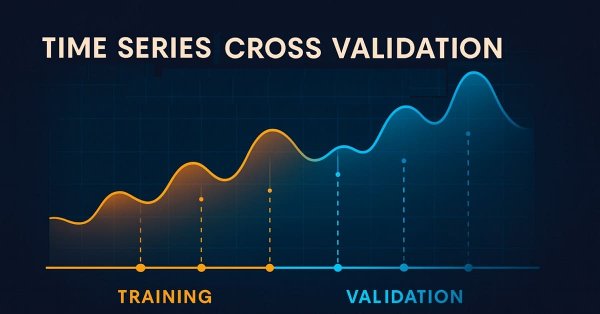
In this discussion, we contrast the classical approach to time series cross-validation with modern alternatives that challenge its core assumptions. We expose key blind spots in the traditional method—especially its failure to account for evolving market conditions. To address these gaps, we introduce Effective Memory Cross-Validation (EMCV), a domain-aware approach that questions the long-held belief that more historical data always improves performance.
In this article, we will start creating the C_Orders class to be able to send orders to the trading server. We'll do this little by little, as our goal is to explain in detail how this will happen through the messaging system.
This article introduces a fully automated MQL5 system designed to identify and trade market swings with precision. Unlike traditional fixed-bar swing indicators, this system adapts dynamically to evolving price structure—detecting swing highs and swing lows in real time to capture directional opportunities as they form.
Today, we take an important step toward helping every developer understand how to read class structures and quickly build Expert Advisors using the MQL5 Standard Library. The library is rich and expandable, yet it can feel like being handed a complex toolkit without a manual. Here we share and discuss an alternative integration routine—a concise, repeatable workflow that shows how to connect classes reliably in real projects.
In this article, we'll cover the basics of risk management in trading and learn how to create your first functions for calculating the appropriate lot size for a trade, as well as a stop-loss. Additionally, we will go into detail about how these features work, explaining each step. Our goal is to provide a clear understanding of how to apply these concepts in automated trading. Finally, we will put everything into practice by creating a simple script with an include file.
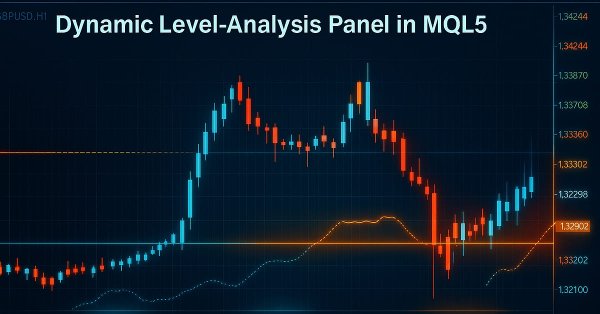
In this article, we explore a powerful MQL5 tool that let's you test any price level you desire with just one click. Simply enter your chosen level and press analyze, the EA instantly scans historical data, highlights every touch and breakout on the chart, and displays statistics in a clean, organized dashboard. You'll see exactly how often price respected or broke through your level, and whether it behaved more like support or resistance. Continue reading to explore the detailed procedure.
This is the first part of an article series presenting the implementation of bivariate copulae in MQL5. This article presents code implementing Gaussian and Student's t-copulae. It also delves into the fundamentals of statistical copulae and related topics. The code is based on the Arbitragelab Python package by Hudson and Thames.
In this series of articles, we look at the challenges faced by algorithmic traders when deploying machine-learning-powered trading strategies. Some challenges within our community remain unseen because they demand deeper technical understanding. Today’s discussion acts as a springboard toward examining the blind spots of cross-validation in machine learning. Although often treated as routine, this step can easily produce misleading or suboptimal results if handled carelessly. This article briefly revisits the essentials of time series cross-validation to prepare us for more in-depth insight into its hidden blind spots.
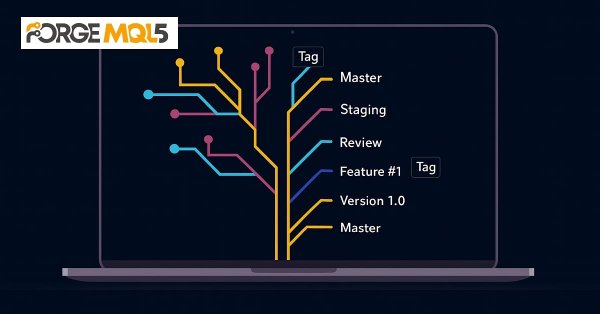
We'll continue developing the Simple Candles and Adwizard projects, while also describing the finer aspects of using the MQL5 Algo Forge version control system and repository.