Learn how to implement a tick-based chart in MQL5 where each bar is built from a fixed number of ticks instead of time. The article covers creating and configuring a custom symbol, capturing real-time ticks, forming OHLC values, and pushing data with CustomRatesUpdate. This approach produces activity-driven candles that better reflect market intensity and short-term momentum for precise intraday analysis.
Learn to engineer an MQL5 indicator that converts trend, momentum, and volatility into a single raw score using a matrix.mqh (ALGLIB). The article covers a separate‑window oscillator to validate the core mathematics, then a main‑chart indicator that plots non‑repainting buy/sell arrows when the score crosses user‑defined thresholds. An optional long‑term EMA filter, a minimum‑bar cooldown, and built‑in alerts make the tool practical for live trading.
This article builds the foundation layer of a twelve-part MQL5 market microstructure toolkit. It implements guarded math helpers (SafeDivide, SafeLog, SafeSqrt, SafeExp, SafeTanh), robust data validation (ValidateSymbolV2, SafeCopyClose), trimmed statistical estimators (robust mean var), a linear regression slope, shared structs, and an FFT. You compile a single include file that hardens indicators and expert advisors against silent numerical failures and standardizes data flow for later parts.
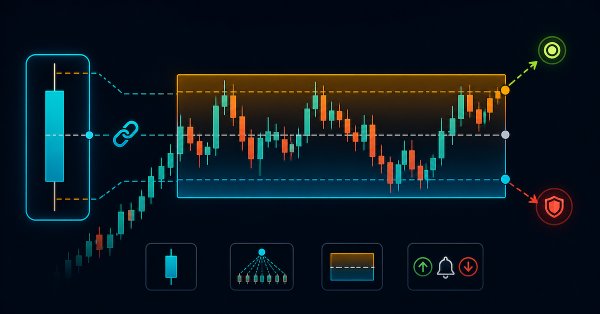
Higher-timeframe CRT ranges are informative, yet traders often execute on lower timeframes without that context. We implement an MQL5 indicator that reads higher-timeframe OHLC, projects the full candle range, body, and wicks onto the active lower-timeframe chart, and marks entries, stops, and targets. This improves situational awareness and removes the need to switch windows.
We present a chart-embedded RSI panel that removes the need for a separate window by attaching momentum directly to live price. The article explains the design and MQL5 code: real-time RSI retrieval, slope-based signal classification, and adaptive positioning. Traders get RSI value, state, and signal strength where decisions are made, improving clarity across timeframes.
Build a Liquidity Spectrum Volume Profile in MQL5 that allocates volume to equal price bins over a chosen lookback using candle close prices. The guide covers data retrieval with copy functions, binning and normalization, and drawing rectangles and POC lines with chart objects and time offsets to reveal high-activity liquidity zones on the chart.
The article implements GJR-GARCH and TARCH in an MQL5 volatility library and explains why asymmetry improves on standard ARCH/GARCH. It covers model formulation, parameterization, and usage through derived classes and scripts. Readers get code examples for calibration and one-step-ahead forecasting on real data to support risk and diagnostics.
This article implements an MQL5 module that analyzes the lower‑timeframe bars inside each liquidity‑zone base candle. It detects swing points and applies objective rules to classify the internal structure as an ascending, descending, or symmetrical triangle; a rectangle; M; W; or undefined. The indicator displays geometry labels on the chart and adds the pattern to alerts, reducing manual lower‑timeframe inspection.
An MQL5 control system that blocks orders outside scheduled trading hours and during scheduled news releases, converting time rules into executable restrictions. It combines a permissions management mechanism, a transaction-level expert advisor, and a visual dashboard for real-time status and upcoming restrictions. Configuration is accomplished using editable files, with caching and a CSV audit log for traceability.
Create a traditional Renko indicator in MQL5 that converts candlestick closing prices into fixed-size blocks displayed on the main chart. We calculate the movement from the closing price of the last block, create new blocks of a user-defined size, confirm reversals using the two-block rule, manage block closing prices in a dynamic array, and display rectangles for visualizing the trend in real time.
The article presents an MQL5 method for detecting psychological round numbers by converting prices to strings and counting trailing zeros (ZeroSize). It outlines the theory of institutional liquidity at integers, explains the GetZeroCount logic with tick-size normalization to avoid floating‑point errors, and details hierarchical visualization. Case studies across forex, metals, and crypto, plus timeframe filters and inputs, show how to use confluence and basic risk controls in practice.
Head and Shoulders patterns are difficult to identify consistently in live market data due to noise and structural ambiguity. This article presents a structured, triangle-based MQL5 indicator that isolates pattern components, constructs the neckline, and validates formations using ATR, symmetry, and slope constraints. The system detects and draws standard and inverse patterns, assigns a quality score, and confirms breakouts with optional alerts, enabling consistent and rule-based chart analysis.
Time series forecasting in trading has evolved from traditional statistical models (like ARIMA) to deep learning approaches, but both require heavy tuning and training. Inspired by advances in NLP, Google’s TimesFM introduces a pretrained “foundation model” for time series that can perform strong forecasts even without task-specific training. For traders, this is powerful because it can be efficiently fine-tuned on their own data using lightweight methods like LoRA, reducing overfitting while adapting to changing market conditions.
This article builds the user interface layer of an Account Audit System in MQL5 using CChartObject classes. We construct an on-chart dashboard that displays key metrics such as start/end balance, net profit, total trades, wins/losses, win rate, withdrawals, and a star-based performance rating. A menu button lets you show or hide the panel and restores one-click trading, delivering a clean, usable foundation for the broader audit pipeline.
This article explores the practical application of L1 trend filtering in MetaTrader 5, covering both its mathematical foundations and usage in MQL5 programs. The L1 filter enables extraction of piecewise-linear trends that preserve essential market structure while reducing price noise. The study analyzes parameter scaling, trend estimation behavior, and integration of the method into algorithmic trading strategies. Experimental results demonstrate how L1 trend filtering can enhance signal stability, trade timing, and overall robustness of trading systems.
GoertzelBrain combines Goertzel spectral analysis with an online‑trained neural network ensemble to convert cycle features into a directional confirmation signal. The indicator builds a compact feature vector from the dominant period, amplitude, confidence and their dynamics, plus local volatility, and outputs +1, −1 or 0. The article provides the full MQL5 implementation, explains the architecture and feature engineering, and shows how to use it as a directional filter.
The article demonstrates how to build a Volume Bubble Indicator in MQL5 that visualizes market activity using statistical normalization. It covers how to work with tick and real volume, compute the mean and standard deviation over a rolling window, and normalize volume values to identify relative strength. You will implement chart objects to display bubbles with dynamic size and color, providing a clear representation of volume intensity directly on the chart.
This article extends the MQL5 footprint chart with market-structure and order-flow layers: volume-profile bars, point of control, value-area highlighting, stacked imbalance detection, absorption zones, and single-print/unfinished markers. We expand bar data structures, add functions for POC/value area, imbalance, and absorption, and build a fixed-order rendering pipeline. You will get ready-to-use inputs, metadata, and drawing utilities to integrate and customize these layers in your indicator.
In this article, we will consider the specifics of applying some trend criteria in practice. We will also try to develop several new criteria. The focus will be on the efficiency of applying these criteria to market data analysis and trading.
In this article, we explore practical and robust risk management techniques specifically tailored for liquidity-based trading. You will learn how to protect positions during retests, handle false breakouts with confidence, and identify signs of potential level manipulation. By the end, you will have built an adaptive Expert Advisor capable of managing zone flips and executing strategic pending orders with integrated risk control.
The article enhances an MQL5 footprint indicator with a compact box above each candle that summarizes net delta, total volume, and buy/sell percentages. We implement supersampled anti‑aliased rendering, rounded corners via arc and quadrilateral rasterization, and per‑pixel alpha compositing. Supporting utilities include ARGB conversion, scanline fills, and box‑filter downsampling. The box delivers fast sentiment reads that stay legible across zoom levels.
This article builds an order-flow footprint indicator in MQL5 that aggregates tick-by-tick volume into quantized price levels and supports Bid vs Ask and Delta display modes. A canvas overlay renders color-scaled volume text aligned with the candles and updates on every tick. You will learn sorting of price levels, max-value normalization for color mapping, and responsive redraws on zoom, scroll, and resize to read volume distribution and aggressor dominance inside each bar.
This article develops a practical MQL5 indicator that identifies Hidden Smash Day bars by strict numeric criteria and optional confirmation on the following session. We cover detection routines, buffer registration, and plot configuration to place arrows at valid bars. The approach delivers stable, non-repainting signals for historical testing and real-time monitoring.
This article details an MQL5 framework that restricts trading to an approved set of symbols. The solution combines a shared library, a configuration dashboard, and an enforcement Expert Advisor that validates each trade against a whitelist and logs blocked attempts. It includes fully functional code examples, a clear explanation of the structural design decisions, and validation tests that confirm reliable symbol filtering, controlled market exposure, and transparent monitoring of rule enforcement.
For maximum reliability and productivity in MetaTrader products built with MQL, this article advocates a development approach based on reusable “packages” managed by KnitPkg, a project manager for MQL5/MQL4. A package can be used as a building block for other packages or as the foundation for final artifacts that run directly on the MetaTrader platform, such as EAs, indicators, and more.
During sideways price movements, traders face excessive signals from multiple moving average crossovers. Today, we discuss how ALGLIB preprocesses raw price data to produce filtered crossover layers, which can also generate alerts when they occur. Join this discussion to learn how a mathematical library can be leveraged in MQL5 programs.
In this part of the Price Action Analysis Toolkit Development series, we develop an MQL5 indicator that automatically detects rising and falling wedge patterns in real time. The system confirms pivot structures, validates boundary convergence mathematically, prevents overlapping formations, and monitors breakout and failure conditions with precise visual feedback. Built using a clean object-oriented architecture, this implementation converts subjective wedge recognition into a structured, state-aware analytical component designed to strengthen disciplined price action analysis.
This article shows how to build an MQL5 indicator that reads a CSV trading history, extracts Profit($) values and total trades, and computes a cumulative balance progression. We plot the curve in a separate indicator window, auto-scale the Y-axis, and draw horizontal and vertical axes for alignment. The indicator updates on a timer and redraws only when new trades appear. Optional labels display per-trade profit and loss to help assess performance and drawdowns directly on the chart.
Built on lower-timeframe market structure, and then orchestrated on the higher-timeframe, this indicator detects swing extremes where price becomes statistically vulnerable to reversal. It visualizes overextension and pullback zones, offering early insight into mean-reversion behavior.
In this article, we enhance the hybrid Time Price Opportunity (TPO) market profile indicator in MQL5 by integrating volume data to calculate volume-based point of control, value areas, and volume-weighted average price with customizable highlighting options. The system introduces advanced features like initial balance detection, key level extension lines, split profiles, and alternative TPO characters such as squares or circles for improved visual analysis across multiple timeframes.
We translate the EMA‑50 retest idea into a behavior‑driven Expert Advisor for intraday trading. The study formalizes trend bias, EMA interaction (pierce and close), reaction confirmation, and optional filters, then implements them in MQL5 with modular functions and resource‑safe handles. Visual testing in the Strategy Tester verifies signal correctness. The result is a clear template for coding discretionary bounces.
In this article, we develop a custom indicator in MQL5 for hybrid Time Price Opportunity (TPO) market profiles, supporting multiple session timeframes such as intraday, daily, weekly, monthly, and fixed periods with timezone adjustments. The indicator quantizes prices into a grid, tracks session data including highs, lows, opens, and closes, and calculates key elements like the point of control and value area based on TPO counts. It renders profiles visually on the chart with customizable colors for TPO letters, single prints, value areas, POC, and close markers, enabling detailed session analysis
This article turns Market Memory Zones from a chart-only concept into a complete MQL5 Expert Advisor. It automates Displacement, Structure Transition (CHoCH), and Liquidity Sweep zones using ATR- and candle-structure filters, applies lower-timeframe confirmation, and enforces risk-based position sizing with dynamic SL and structure-based TP. You will get the code architecture for detection, entries, trade management, and visualization, plus a brief backtest review.
We convert Larry Williams’ Smash Day reversal rules into a practical MQL5 indicator that flags confirmed setups with arrows. Step by step, the text shows buffer binding, plot properties, historical mapping, and real‑time updates inside OnCalculate. Adjustable lookback parameters and clean chart rendering help you detect valid reversals quickly while keeping final trade decisions discretionary and context‑driven.
Learn how to build a Supertrend-driven Expert Advisor in MQL5 from the ground up. The article covers embedding the indicator as a resource, reading buffer values on closed bars, detecting confirmed flips, aligning and switching positions, and configuring stop-loss modes and position sizing. It concludes with Strategy Tester setup and reproducible tests, leaving you with a configurable EA and a clear framework for further research and extensions.
We determine the overbought and oversold condition of the market according to chaos theory: integrating the principles of chaos theory, fractal geometry and neural networks to forecast financial markets. The study demonstrates the use of the Lyapunov exponent as a measure of market randomness and the dynamic adaptation of trading signals. The methodology includes an algorithm for generating fractal noise, hyperbolic tangent activation, and moment optimization.
In this article, we explore how to build a position information visualization tool using the MQL5 Standard Library’s CCanvas. This project strengthens your skills in working with library modules while providing traders with a practical tool to visualize and interact with open positions directly on a live chart. Join the discussion to learn more.
Build a non‑repainting Supertrend in MQL5 for MetaTrader 5 from first principles. We use an iATR handle and CopyBuffer for volatility, bind buffers with SetIndexBuffer, and configure plots (DRAWCOLORCANDLES plus two line bands) via PlotIndexSetInteger. The logic updates only on closed bars with EMPTY_VALUE to suppress inactive bands, exposing atrPeriod and atrMultiplier inputs. You get a clean, EA‑ready overlay with documented buffers for strategies and signals.
The extent of liquidity zones and the magnitude of the breakout range are key variables that substantially affect the probability of a retest occurring. In this discussion, we outline the complete process for developing an indicator that incorporates these ratios.
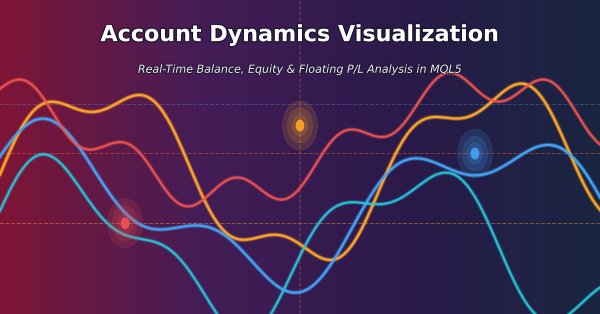
Create a custom MT5 indicator that processes the entire deal history and plots starting balance, balance, equity, and floating P/L as continuous curves. It updates per bar, aggregates positions across symbols, and avoids external dependencies through local caching. Use it to inspect equity–balance divergence, realized vs. unrealized results, and the timing of risk deployment.