Wave analysis is one of the methods used in technical analysis. This article focuses on two less conventional wave patterns: triangular and sawtooth waves. These formations underpin a number of technical indicators designed for market price analysis.
In this article, we build a versatile RSI indicator in MQL5 supporting multiple variants, data sources, and smoothing methods for improved analysis. We add hue shifts for color visuals, dynamic boundaries for overbought/oversold zones, and notifications for trend alerts. It includes multi-timeframe support with interpolation, offering us a customizable RSI tool for diverse strategies.
In this discussion, we will develop an indicator to identify price zones created by strong market activity, such as impulsive moves, structure shifts, and liquidity events. These zones represent areas where the market has left “memory” due to unfilled orders or rapid price displacement. By marking these regions on the chart, the indicator highlights where price is statistically more likely to revisit and react in the future.
This article presents the development of an arbitrage analysis panel in MQL5. How to get fair exchange rates on Forex in different ways? Create an indicator to obtain deviations of market prices from fair exchange rates, as well as to assess the benefits of arbitrage ways of exchanging one currency for another (as in triangular arbitrage).
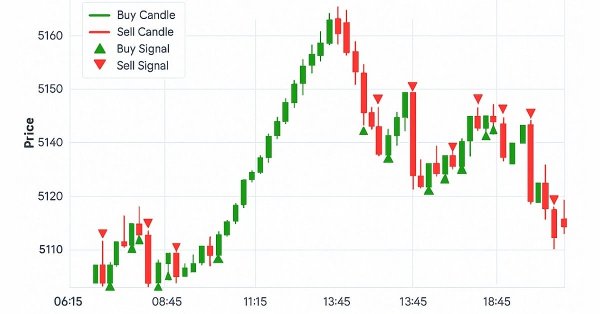
In this article, we enhance the Smart WaveTrend Crossover indicator in MQL5 by integrating canvas-based drawing for fog gradient overlays, signal boxes that detect breakouts, and customizable buy/sell bubbles or triangles for visual alerts. We incorporate risk management features with dynamic take-profit and stop-loss levels calculated via candle multipliers or percentages, displayed through lines and a table, alongside options for trend filtering and box extensions.
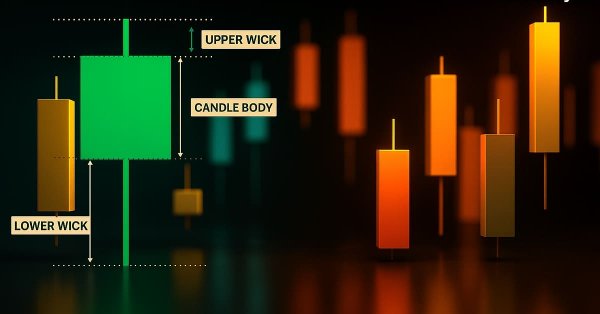
This article presents the design and MetaTrader 5 implementation of the Candle Pressure Index (CPI)—a CLV-based overlay that visualizes intra-Bar buying and selling pressure directly on price charts. The discussion focuses on candle structure, pressure classification, visualization mechanics, and a non-repainting, transition-based alert system designed for consistent behavior across timeframes and instruments.
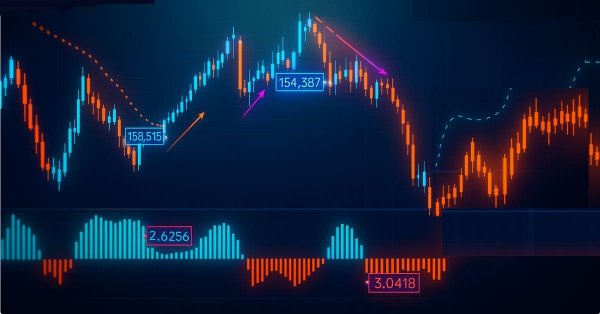
In this article, we develop a custom indicator in MQL5 called Smart WaveTrend Crossover, utilizing dual WaveTrend oscillators—one for generating crossover signals and another for trend filtering—with customizable parameters for channel, average, and moving average lengths. The indicator plots colored candles based on the trend direction, displays buy and sell arrow signals on crossovers, and includes options to enable trend confirmation and adjust visual elements like colors and offsets.
Build a practical MetaTrader 5 “Sigma Score” indicator from scratch and learn what it really measures: The z-score of log returns (how many standard deviations the latest move is from the recent average). The article walks through every code block in OnInit(), OnCalculate(), and OnDeinit(), then shows how to interpret thresholds (e.g., ±2) and apply the Sigma Score as a simple “market stress meter” for mean-reversion and momentum trading.
In this article, we enhance the gauge-based indicator in MQL5 to support multiple oscillators, allowing user selection through an enumeration for single or combined displays. We introduce sector and round gauge styles via derived classes from a base gauge framework, improving case rendering with arcs, lines, and polygons for a more refined visual appearance.
In high-probability support and resistance zones, valid entry confirmation signals are always present once the zone has been correctly identified. In this discussion, we build an intelligent MQL5 program that automatically detects entry conditions within these zones. We leverage well-known candlestick patterns alongside native confirmation indicators to validate trade decisions. Click to read further.
In this article, we develop a gauge-style RSI indicator in MQL5 that visualizes Relative Strength Index values on a circular scale with a dynamic needle, color-coded ranges for overbought and oversold levels, and customizable legends. We utilize the Canvas class to draw elements like arcs, ticks, and pies, ensuring smooth updates on new RSI data.
In this article, we create a Pivot-Based Trend Indicator in MQL5 that calculates fast and slow pivot lines over user-defined periods, detects trend directions based on price relative to these lines, and signals trend starts with arrows while optionally extending lines beyond the current bar. The indicator supports dynamic visualization with separate up/down lines in customizable colors, dotted fast lines that change color on trend shifts, and optional gradient filling between lines, using a canvas object for enhanced trend-area highlighting.
This article introduces the Pattern Density Heatmap, a price‑action mapping tool that transforms repeated candlestick pattern detections into statistically significant support and resistance zones. Rather than treating each signal in isolation, the EA aggregates detections into fixed price bins, scores their density with optional recency weighting, and confirms levels against higher‑timeframe data. The resulting heatmap reveals where the market has historically reacted—levels that can be used proactively for trade timing, risk management, and strategy confidence across any trading style.
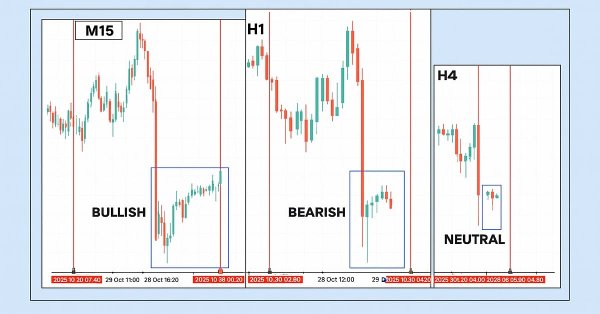
This article presents the Multi‑Timeframe Visual Analyzer, an MQL5 Expert Advisor that reconstructs and overlays higher‑timeframe candles directly onto your active chart. It explains the implementation, key inputs, and practical outcomes, supported by an animated demo and chart examples showing instant toggling, multi‑timeframe confirmation, and configurable alerts. Read on to see how this tool can make chart analysis faster, clearer, and more efficient.
Learn how to build a complete Kagi Chart engine in MQL5—constructing price reversals, generating dynamic line segments, and updating Kagi structures in real time. This first part teaches you how to render Kagi charts directly on MetaTrader 5, giving traders a clear view of trend shifts and market strength while preparing for automated Kagi-based trading logic in Part 2.
This article is intended for algorithmic traders, quantitative analysts, and MQL5 developers interested in enhancing their understanding of candlestick pattern recognition through practical implementation. It provides an in‑depth exploration of the CandlePatternSearch.mq5 Expert Advisor—a complete framework for detecting, visualizing, and monitoring classical candlestick formations in MetaTrader 5. Beyond a line‑by‑line review of the code, the article discusses architectural design, pattern detection logic, GUI integration, and alert mechanisms, illustrating how traditional price‑action analysis can be automated efficiently.
Gamma and Delta were originally developed as risk-management tools for hedging options exposure, but over time they evolved into powerful instruments for advanced scalping, order-flow modeling, and microstructure trading. Today, they serve as real-time indicators of price sensitivity and liquidity behavior, enabling traders to anticipate short-term volatility with remarkable precision.
Many traders struggle to identify genuine reversals. This article presents an EA that combines RVGI, CCI (±100), and an SMA trend filter to produce a single clear reversal signal. The EA includes an on-chart panel, configurable alerts, and the full source file for immediate download and testing.
This article considers the Rademacher and Walsh functions. We will explore ways to apply these functions to financial time series analysis and also consider various applications for them in trading.
Simplify your MetaTrader 5 charts with the Multi Indicator Handler EA. This interactive dashboard merges trend, momentum, and volatility indicators into one real‑time panel. Switch instantly between profiles to focus on the analysis you need most. Declutter with one‑click Hide/Show controls and stay focused on price action. Read on to learn step‑by‑step how to build and customize it yourself in MQL5.
This article introduces the “Multi-Timeframe Harmony Index”—an advanced Expert Advisor for MetaTrader 5 that calculates a weighted bias from multiple timeframes, smooths the readings using EMA, and displays the results in a clean chart panel dashboard. It includes customizable alerts and automatic buy/sell signal plotting when strong bias thresholds are crossed. Suitable for traders who use multi-timeframe analysis to align entries with overall market structure.
Global market sessions shape the rhythm of the trading day, and understanding their overlap is vital to timing entries and exits. In this article, we’ll build an interactive trading sessions EA that brings those global hours to life directly on your chart. The EA automatically plots color‑coded rectangles for the Asia, Tokyo, London, and New York sessions, updating in real time as each market opens or closes. It features on‑chart toggle buttons, a dynamic information panel, and a scrolling ticker headline that streams live status and breakout messages. Tested on different brokers, this EA combines precision with style—helping traders see volatility transitions, identify cross‑session breakouts, and stay visually connected to the global market’s pulse.
The UT BOT ATR Trailing Indicator is a personal and customizable indicator that is very effective for traders who like to make quick decisions and make money from differences in price referred to as short-term trading (scalpers) and also proves to be vital and very effective for long-term traders (positional traders).
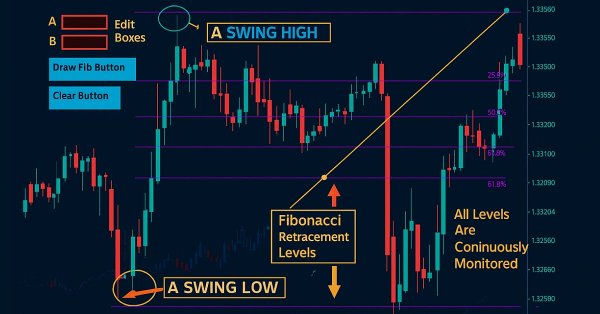
Fibonacci tools are among the most popular instruments used by technical analysts. In this article, we’ll build an Interactive Fibonacci EA that draws retracement and extension levels that react dynamically to price movement, delivering real‑time alerts, stylish lines, and a scrolling news‑style headline. Another key advantage of this EA is flexibility; you can manually type the high (A) and low (B) swing values directly on the chart, giving you exact control over the market range you want to analyze.
Using a ready-made solution in trading without concerning yourself with the internal workings of the system may sound comforting, but this is not always the case for developers. Eventually, an upgrade, misperformance, or unexpected error will arise, and it becomes essential to trace exactly where the issue originates to diagnose and resolve it quickly. Today’s discussion focuses on uncovering what normally happens behind the scenes of a trading Expert Advisor, and on developing a custom dedicated class for displaying and logging backend processes using MQL5. This gives both developers and traders the ability to quickly locate errors, monitor behavior, and access diagnostic information specific to each EA.
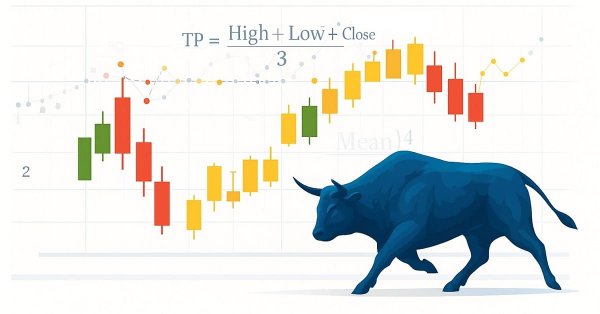
Statistics has always been at the heart of financial analysis. By definition, statistics is the discipline that collects, analyzes, interprets, and presents data in meaningful ways. Now imagine applying that same framework to candlesticks—compressing raw price action into measurable insights. How helpful would it be to know, for a specific period of time, the central tendency, spread, and distribution of market behavior? In this article, we introduce exactly that approach, showing how statistical methods can transform candlestick data into clear, actionable signals.
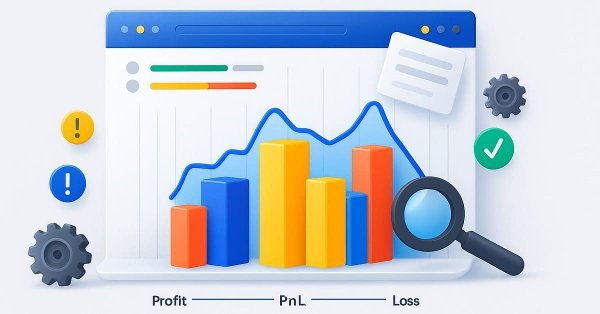
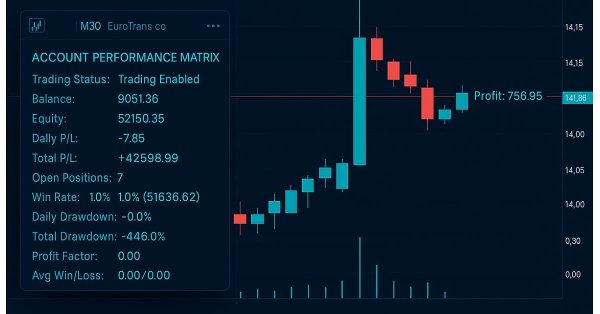
This indicator acts as a discipline enforcer by tracking account equity, profit/loss, and drawdown in real-time while displaying a performance dashboard. It can help traders stay consistent, avoid overtrading, and comply with prop-firm challenge rules.
The Parafrac V2 Oscillator is an advanced technical analysis tool that integrates the Parabolic SAR with the Average True Range (ATR) to overcome limitations of its predecessor, which relied on fractals and was prone to signal spikes overshadowing previous and current signals. By leveraging ATR’s volatility measure, the version 2 offers a smoother, more reliable method for detecting trends, reversals, and divergences, helping traders reduce chart congestion and analysis paralysis.
This article is about orthogonal polynomials. Their use can become the basis for a more accurate and effective analysis of market information allowing traders to make more informed decisions.
This article is the first installment in a two-part series designed to impart practical skills and best practices for writing custom indicators in MQL5. Using Heikin Ashi as a working example, the article explores the theory behind Heikin Ashi charts, explains how Heikin Ashi candlesticks are calculated, and demonstrates their application in technical analysis. The centerpiece is a step-by-step guide to developing a fully functional Heikin Ashi indicator from scratch, with clear explanations to help readers understand what to code and why. This foundational knowledge sets the stage for Part Two, where we will build an expert advisor that trades based on Heikin Ashi logic.
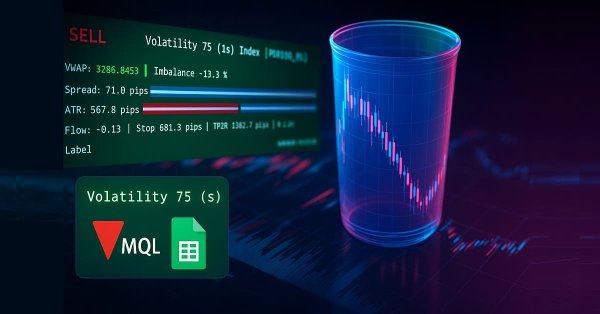
In Part 38, we build a production-grade MT5 monitoring panel that converts raw ticks into actionable signals. The EA buffers tick data to compute tick-level VWAP, a short-window imbalance (flow) metric, and ATR-based position sizing. It then visualizes spread, ATR, and flow with low-flicker bars. The system calculates a suggested lot size and a 1R stop, and issues configurable alerts for tight spreads, strong flow, and edge conditions. Auto-trading is intentionally disabled; the focus remains on robust signal generation and a clean user experience.
Chart Synchronization for Easier Technical Analysis is a tool that ensures all chart timeframes display consistent graphical objects like trendlines, rectangles, or indicators across different timeframes for a single symbol. Actions such as panning, zooming, or symbol changes are mirrored across all synced charts, allowing traders to seamlessly view and compare the same price action context in multiple timeframes.
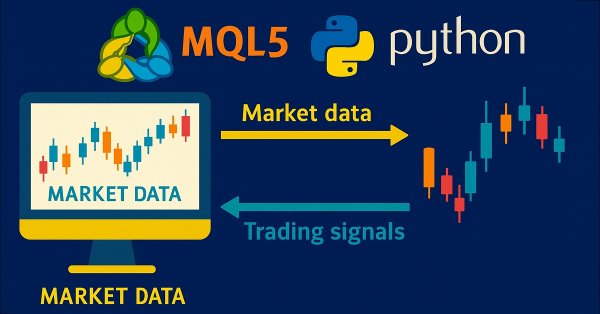
Harness the full potential of your MetaTrader 5 terminal by leveraging Python’s data-science ecosystem and the official MetaTrader 5 client library. This article demonstrates how to authenticate and stream live tick and minute-bar data directly into Parquet storage, apply sophisticated feature engineering with Ta and Prophet, and train a time-aware Gradient Boosting model. We then deploy a lightweight Flask service to serve trade signals in real time. Whether you’re building a hybrid quant framework or enhancing your EA with machine learning, you’ll walk away with a robust, end-to-end pipeline for data-driven algorithmic trading.
The article considers an optimized version of the Market Profile indicator, where rendering with multiple graphical objects is replaced with rendering on a canvas - an object of the CCanvas class.
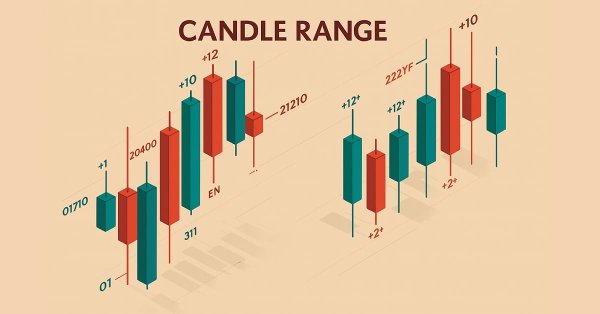
Upgrade your market reading with the Candle-Range Theory suite for MetaTrader 5, a fully MQL5-native solution that converts raw price bars into real-time volatility intelligence. The lightweight CRangePattern library benchmarks each candle’s true range against an adaptive ATR and classifies it the instant it closes; the CRT Indicator then projects those classifications on your chart as crisp, color-coded rectangles and arrows that reveal tightening consolidations, explosive breakouts, and full-range engulfment the moment they occur.
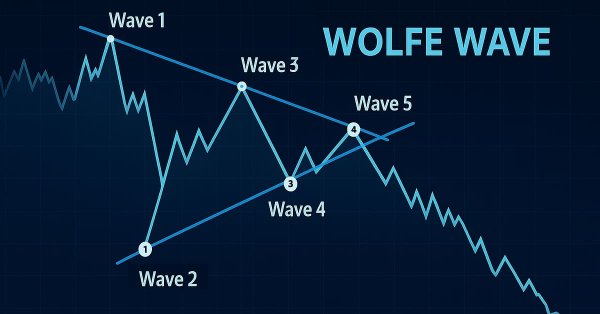
This article shows how to programmatically identify bullish and bearish Wolfe Wave patterns and trade them using MQL5. We’ll explore how to identify Wolfe Wave structures programmatically and execute trades based on them using MQL5. This includes detecting key swing points, validating pattern rules, and preparing the EA to act on the signals it finds.
The article dwells on multivariate 3D price charts and their creation. We will also consider how 3D bars predict price reversals, and how Python and MetaTrader 5 allow us to plot these volume bars in real time.
In this article, we’ve transitioned from manually coding candlestick‑pattern detection in Python to leveraging TA‑Lib, a library that recognizes over sixty distinct patterns. These formations offer valuable insights into potential market reversals and trend continuations. Follow along to learn more.
In this article, we will consider Market Profile indicator. We will find out what lies behind this name, try to understand its operation principles and have a look at its terminal version (MarketProfile).
Candlestick patterns are fundamental to price-action trading, offering valuable insights into potential market reversals or continuations. Envision a reliable tool that continuously monitors each new price bar, identifies key formations such as engulfing patterns, hammers, dojis, and stars, and promptly notifies you when a significant trading setup is detected. This is precisely the functionality we have developed. Whether you are new to trading or an experienced professional, this system provides real-time alerts for candlestick patterns, enabling you to focus on executing trades with greater confidence and efficiency. Continue reading to learn how it operates and how it can enhance your trading strategy.