One major challenge is managing multiple chart windows of the same pair running the same program with different features. Let's discuss how to consolidate several integrations into one main program. Additionally, we will share insights on configuring the program to print to a journal and commenting on the successful signal broadcast on the chart interface. Find more information in this article as we progress the article series.
In this article we explore different ways in which the eigenvectors and eigenvalues can be applied in exploratory data analysis to reveal unique relationships in data.
In this article, we will explore the capabilities of the powerful MQL5 language in drawing various indicator styles on Meta Trader 5. We will also look at scripts and how they can be used in our model.
This is a continuation of the series for beginners. In this article, we'll look at how to create constants and variables, write dates, colors, and other useful data. We will learn how to create enumerations like days of the week or line styles (solid, dotted, etc.). Variables and expressions are the basis of programming. They are definitely present in 99% of programs, so understanding them is critical. Therefore, if you are new to programming, this article can be very useful for you. Required programming knowledge level: very basic, within the limits of my previous article (see the link at the beginning).
In this article, we will look at drawing arrow multi-symbol multi-period indicators. We will also improve the class methods for correct display of arrows showing data from arrow indicators calculated on a symbol/period that does not correspond to the symbol/period of the current chart.
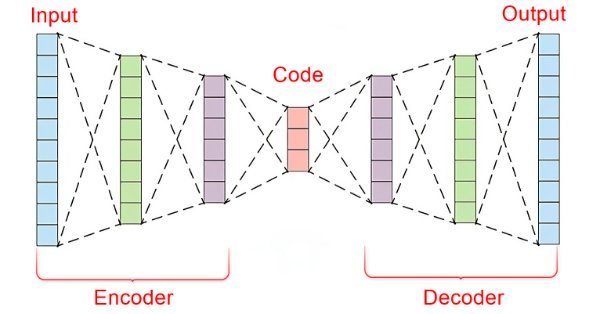
In the fast-paced world of financial markets, separating meaningful signals from the noise is crucial for successful trading. By employing sophisticated neural network architectures, autoencoders excel at uncovering hidden patterns within market data, transforming noisy input into actionable insights. In this article, we explore how autoencoders are revolutionizing trading practices, offering traders a powerful tool to enhance decision-making and gain a competitive edge in today's dynamic markets.
Learn how to create custom indicators using MQL5. This introductory article will guide you through the fundamentals of building simple custom indicators and demonstrate a hands-on approach to coding different custom indicators for any MQL5 programmer new to this interesting topic.
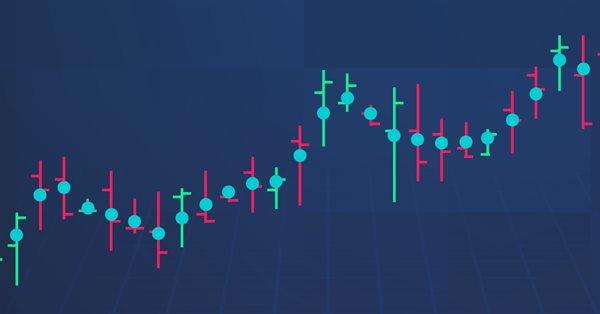
In this article, we will provide another volatility-based indicator named Chaikin Volatility. We will understand how to build a custom indicator after identifying how it can be used and constructed. We will share some simple strategies that can be used and then test them to understand which one can be better.
In this article, I will consider the option of obtaining information about closed positions based on their trading history. Besides, I will create a simple indicator that displays the approximate profit/loss of positions on each bar as a diagram.
In this article, we will review the structure of the indicator buffer in multi-symbol, multi-period indicators and organize the display of colored buffers of these indicators on the chart.
This article is an introduction to a series of articles about programming. It is assumed here that the reader has never dealt with programming before. So, this series starts from the very basics. Programming knowledge level: Absolute Beginner.
In this article, we will look at the principles of creating multi-symbol, multi-period indicators. We will also see how to access the data of such indicators from Expert Advisors and other indicators. We will consider the main features of using multi-indicators in Expert Advisors and indicators and will see how to plot them through custom indicator buffers.
Examples of passing indicators to a perceptron. The article describes general concepts and showcases the simplest ready-made Expert Advisor followed by the results of its optimization and forward test.
We are all familiar with the concept of seasonality, for example, we are all accustomed to rising prices for fresh vegetables in winter or rising fuel prices during severe frosts, but few people know that similar patterns exist in the Forex market.
Unlock the secrets of MQL5 programming in our latest article! Delve into the essentials of structures, classes, and time functions, empowering your coding journey. Whether you're a beginner or an experienced developer, our guide simplifies complex concepts, providing valuable insights for mastering MQL5. Elevate your programming skills and stay ahead in the world of algorithmic trading!
In this article, we investigate how the Generalized Hurst Exponent and the Variance Ratio test can be utilized to analyze the behaviour of price series in MQL5.
In this reference article, we will look at standard indicators from the Trend Indicators category. We will create ready-to-use templates for indicator use in EAs - declaring and setting parameters, indicator initialization and deinitialization, as well as receiving data and signals from indicator buffers in EAs.
In this article, we will look at standard indicators of the Volume and Bill Williams' indicators category. We will create ready-to-use templates for indicator use in EAs - declaring and setting parameters, indicator initialization and deinitialization, as well as receiving data and signals from indicator buffers in EAs.
Explore the fundamentals of MQL5 programming in this beginner-friendly article, where we demystify arrays, custom functions, preprocessors, and event handling, all explained with clarity making every line of code accessible. Join us in unlocking the power of MQL5 with a unique approach that ensures understanding at every step. This article sets the foundation for mastering MQL5, emphasizing the explanation of each line of code, and providing a distinct and enriching learning experience.
The article takes a quick look at the ALGLIB 3.19 numerical analysis library, its applications and new algorithms that can improve the efficiency of financial data analysis.
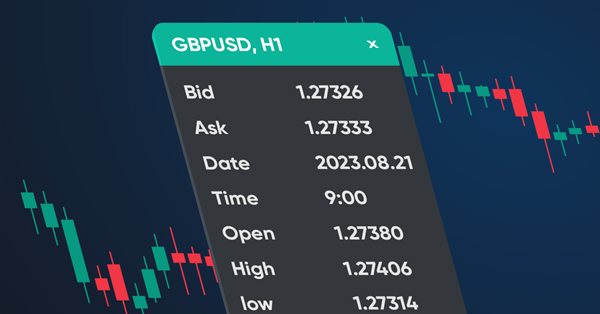
In this article, we will create a dashboard class to be used in indicators and EAs. This is an introductory article in a small series of articles with templates for including and using standard indicators in Expert Advisors. I will start by creating a panel similar to the MetaTrader 5 data window.
Dive into the fascinating realm of algorithmic trading with our beginner-friendly guide to MQL5 programming. Discover the essentials of MQL5, the language powering MetaTrader 5, as we demystify the world of automated trading. From understanding the basics to taking your first steps in coding, this article is your key to unlocking the potential of algorithmic trading even without a programming background. Join us on a journey where simplicity meets sophistication in the exciting universe of MQL5.
In this article, we will consider one of the methods of spectral analysis and signal processing - the discrete Hartley transform. It allows filtering signals, analyzing their spectrum and much more. The capabilities of DHT are no less than those of the discrete Fourier transform. However, unlike DFT, DHT uses only real numbers, which makes it more convenient for implementation in practice, and the results of its application are more visual.
In this article we explore the practical implementation of elastic net regression to minimize overfitting and at the same time automatically separate useful predictors from those that have little prognostic power.
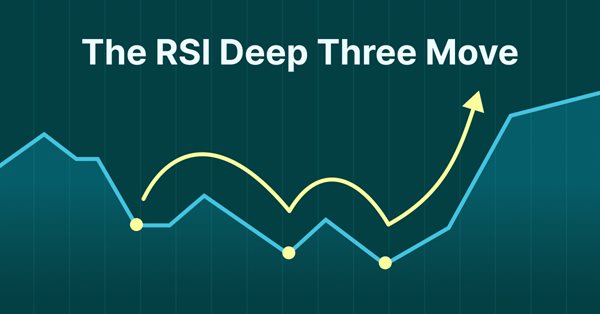
Presenting the RSI Deep Three Move Trading Technique in MetaTrader 5. This article is based on a new series of studies that showcase a few trading techniques based on the RSI, a technical analysis indicator used to measure the strength and momentum of a security, such as a stock, currency, or commodity.
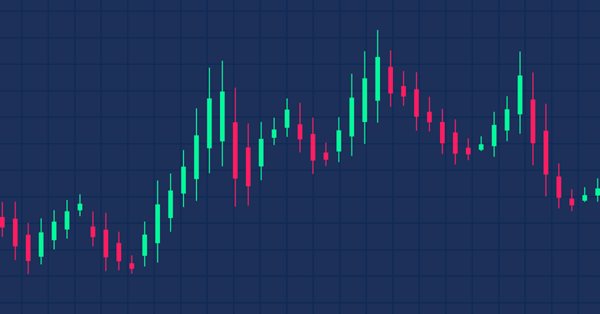
In this article, we will learn how to create a custom indicator using MQL5 based on our preferences, to be used in MetaTrader 5 to help us read charts or to be used in automated Expert Advisors.
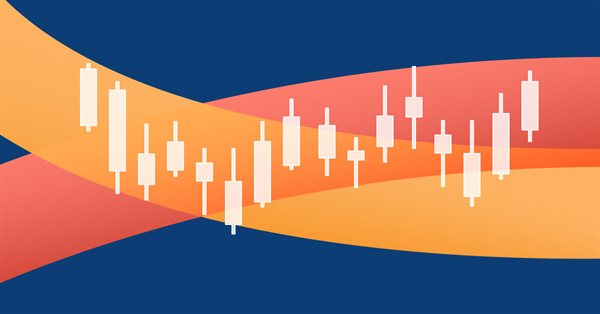
Gary Anderson developed a method of market analysis based on a theory he dubbed the Janus Factor. The theory describes a set of indicators that can be used to reveal trends and assess market risk. In this article we will implement these tools in mql5.
Category Theory is a diverse and expanding branch of Mathematics which is only recently getting some coverage in the MQL5 community. These series of articles look to explore and examine some of its concepts & axioms with the overall goal of establishing an open library that provides insight while also hopefully furthering the use of this remarkable field in Traders' strategy development.
In this article I'll introduce a method for creating custom indicators whose drawings are made using the class CCanvas from standard library and see charts properties for coordinates conversion. I'll approach specially indicators which need to fill the area between two lines using transparency.
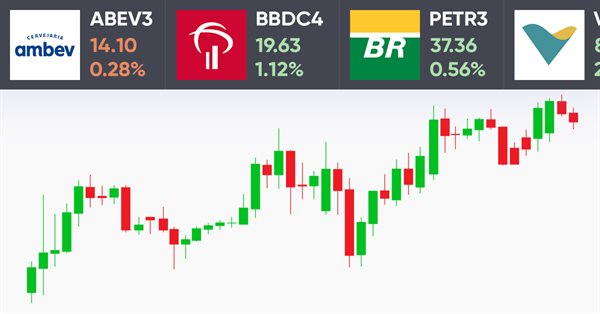
How do you like the idea of reviving the basic version of our ticker tape panel? The first thing we will do is change the panel to be able to add an image, such as an asset logo or some other image, so that the user could quickly and easily identify the displayed symbol.
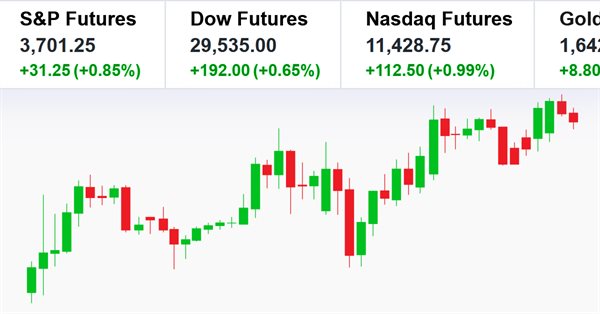
Here I will show how to create screens with price tickers which are usually used to display quotes on the exchange. I will do it by only using MQL5, without using complex external programming.
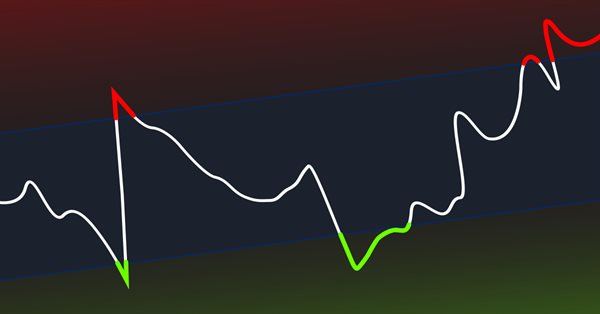
In this article, I will make an attempt to consider some ways of building non-linear indicators and their use in trading. There are quite a few indicators in the MetaTrader trading platform that use non-linear approaches.
How do you like the idea of adding a new chart type to the MetaTrader 5 platform? Some people say it lacks a few things that other platforms offer. But the truth is, MetaTrader 5 is a very practical platform as it allows you to do things that can't be done (or at least can't be done easily) in many other platforms.
We continue to remove separate parts from our EA. This is the last article within this series. And the last thing to be removed is the sound system. This can be a bit confusing if you haven't followed these article series.
In this article, I will consider several possible approaches to creating adaptive indicators. Adaptive indicators are distinguished by the presence of feedback between the values of the input and output signals. This feedback allows the indicator to independently adjust to the optimal processing of financial time series values.
In this article, I will consider the algorithms allowing you to create your own technical indicator. You will learn how to obtain pretty complex and interesting results with very simple initial assumptions.
This article provides a method to create complex indicators while also avoiding the problems that arise when dealing with multiple plots, buffers and/or combining data from multiple sources.