How to access online data via MetaTrader 5? There are a lot of websites and places on the web, featuring a huge amount information. What you need to know is where to look and how best to use this information.
Today we will add some more resources to our EA. This interesting article can provide some new ideas and methods of presenting information. At the same time, it can assist in fixing minor flaws in your projects.
The article offers a new perspective on indicator interfaces. I am going to focus on convenience. Having tried dozens of different trading strategies over the years, as well as having tested hundreds of different indicators, I have come to some conclusions I want to share with you in this article.
Today we will construct the second part of the Times & Trade system for market analysis. In the previous article "Times & Trade (I)" we discussed an alternative chart organization system, which would allow having an indicator for the quickest possible interpretation of deals executed in the market.
Today we will create Times & Trade with fast interpretation to read the order flow. It is the first part in which we will build the system. In the next article, we will complete the system with the missing information. To implement this new functionality, we will need to add several new things to the code of our Expert Advisor.
How to access custom indicators directly in an Expert Advisor? A trading EA can be truly useful only if it can use custom indicators; otherwise, it is just a set of codes and instructions.
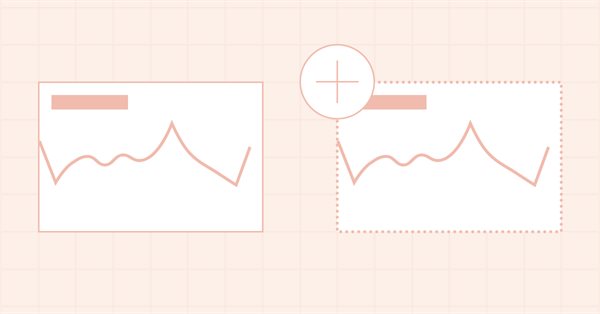
In this article, we will place Chart Trade in a floating window. In the previous part, we created a basic system which enables the use of templates within a floating window.
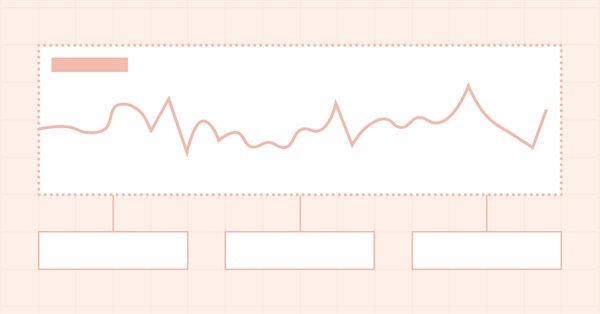
Today we will update the functionality of the indicator system for the first time. In the previous article within the "Multiple indicators on one chart" we considered the basic code which allows using more than one indicator in a chart subwindow. But what was presented was just the starting base of a much larger system.
In the previous article "Multiple indicators on one chart" I presented the concept and the basics of how to use multiple indicators on one chart. In this article, I will provide the source code and will explain it in detail.
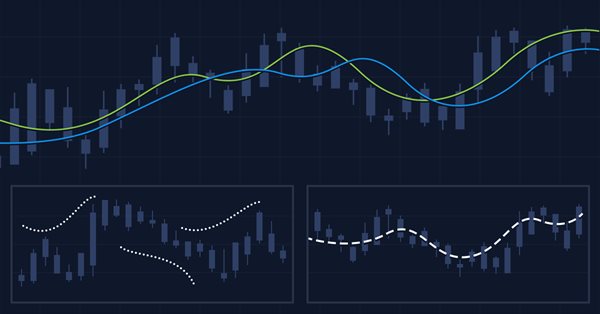
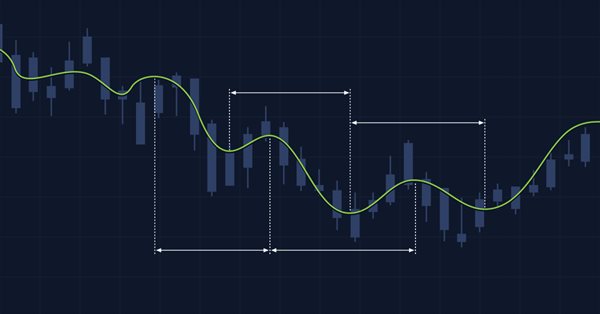
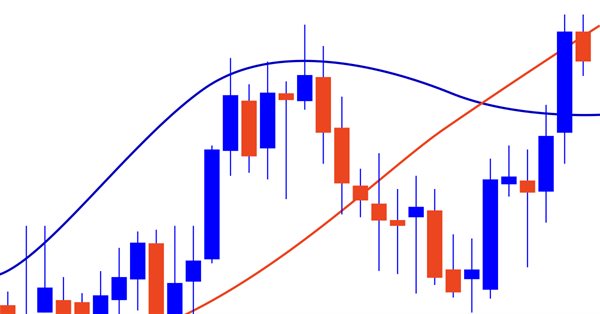
The article considers several methods of applying the Moving Average indicator. Each method involving a curve analysis is accompanied by indicators visualizing the idea. In most cases, the ideas shown here belong to their respected authors. My sole task was to bring them together to let you see the main approaches and, hopefully, make more reasonable trading decisions. MQL5 proficiency level — basic.
Today we will learn how to add multiple indicators running simultaneously on one chart, but without occupying a separate area on it. Many traders feel more confident if they monitor multiple indicators at a time (for example, RSI, STOCASTIC, MACD, ADX and some others), or in some cases even at different assets which an index is made of.
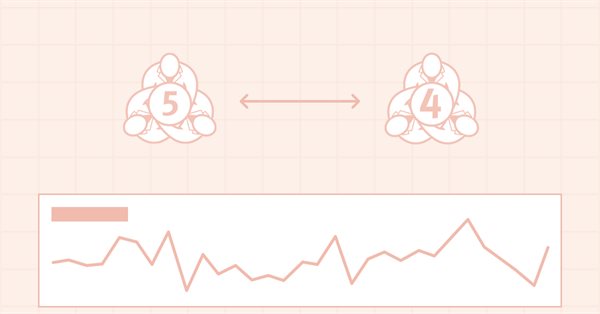
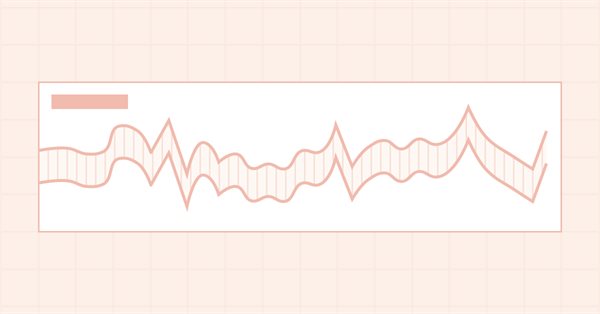
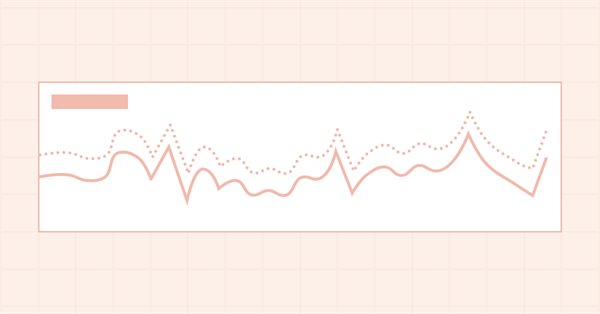
This article presents an analysis of currency data to better understand why expert advisors can have good performance in some regions of time and poor performance in other regions of time.
In this article, we will further develop the idea of drawing graphical objects on charts using keyboard shortcuts. New tools have been added to the library, including a straight line plotted through arbitrary vertices, and a set of rectangles that enable the evaluation of the reversal time and level. Also, the article shows the possibility to optimize code for improved performance. The implementation example has been rewritten, allowing the use of Shortcuts alongside other trading programs. Required code knowledge level: slightly higher than a beginner.
An indicator to report your brokers Bid/Ask spread levels. Now we can use MT5s tick data to analyze what the historic true average Bid/Ask spread actually have recently been. You shouldn't need to look at the current spread because that is available if you show both bid and ask price lines.
Cluster analysis is one of the most important elements of artificial intelligence. In this article, I attempt applying the cluster analysis of the indicator slope to get threshold values for determining whether a market is flat or following a trend.
This is the next article within the series, in which I show how I created a convenient library for manual application of chart graphics by utilizing keyboard shortcuts. The tools used include straight lines and their combinations. In this part, we will view how the drawing tools are applied using the functions described in the first part. The library can be connected to any Expert Advisor or indicator which will greatly simplify the charting tasks. This solution DOES NOT use external dlls, while all the commands are implemented using built-in MQL tools.
The article considers creation of classes of descendant objects of base abstract indicator. Such objects will provide access to features of creating indicator EAs, collecting and getting data value statistics of various indicators and prices. Also, create indicator object collection from which getting access to properties and data of each indicator created in the program will be possible.
The article considers creation of an abstract indicator which further will be used as the base class to create objects of library’s standard and custom indicators.
In the article, consider creation of multi-symbol multi-period standard indicator Accumulation/Distribution. Slightly improve library classes with respect to indicators so that, the programs developed for outdated platform MetaTrader 4 based on this library could work normally when switching over to MetaTrader 5.
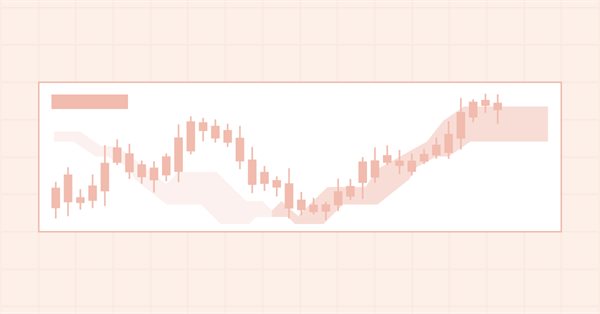
In the article, complete development of objects of multi-period multi-symbol standard indicators. Using Ichimoku Kinko Hyo standard indicator example, analyze creation of compound custom indicators which have auxiliary drawn buffers for displaying data on the chart.
In the article, let’s improve library methods for correct display of multi-symbol multi-period standard indicators, which lines are displayed on the current symbol chart with a shift set in the settings. As well, let’s put things in order in methods of work with standard indicators and remove the redundant code to the library area in the final indicator program.
In the current article, I will improve the library classes to implement the ability to develop multi-symbol multi-period standard indicators requiring several indicator buffers to display their data.
The article considers an example of creating multi-symbol multi-period standard indicators using a single indicator buffer for construction and working in the indicator subwindow. I am going to prepare the library classes for working with standard indicators working in the program main window and having more than one buffer for displaying their data.
Nowadays, voice assistants play a prominent role in human life, as we often use navigators, voice search and translators. In this article, I will try to develop a simple and user friendly system of voice notifications for various trade events, market states or signals generated by trading signals.
In this article, I will start developing the methods of working with standard indicators, which will ultimately allow creating multi-symbol multi-period standard indicators based on library classes. Besides, I will add the "Skipped bars" event to the timeseries classes and eliminate excessive load from the main program code by moving the library preparation functions to CEngine class.
In this article, I am going to improve the classes of indicator buffer objects to work in the multi-symbol mode. This will pave the way for creating multi-symbol multi-period indicators in custom programs. I will add the missing functionality to the calculated buffer objects allowing us to create multi-symbol multi-period standard indicators.
This is the first article in a series, in which I am going to describe a toolkit which enables manual application of chart graphics by utilizing keyboard shortcuts. It is very convenient: you press one key and a trendline appears, you press another key — this will create a Fibonacci fan with the necessary parameters. It will also be possible to switch timeframes, to rearrange layers or to delete all objects from the chart.
The article considers the development of indicator buffer object classes as descendants of the abstract buffer object simplifying declaration and working with indicator buffers, while creating custom indicator programs based on DoEasy library.
In the article, we will consider a sample multi-symbol multi-period indicator using the timeseries classes of the DoEasy library displaying the chart of a selected currency pair on a selected timeframe as candles in a subwindow. I am going to modify the library classes a bit and create a separate file for storing enumerations for program inputs and selecting a compilation language.
The article considers the development of a simple multi-period indicator based on the DoEasy library. Let's improve the timeseries classes to receive data from any timeframes to display it on the current chart period.
Artificial intelligence is often associated with something fantastically complex and incomprehensible. At the same time, artificial intelligence is increasingly mentioned in everyday life. News about achievements related to the use of neural networks often appear in different media. The purpose of this article is to show that anyone can easily create a neural network and use the AI achievements in trading.
There are multiple different approaches to market research and analysis. The main ones are technical and fundamental. In technical analysis, traders collect, process and analyze numerical data and parameters related to the market, including prices, volumes, etc. In fundamental analysis, traders analyze events and news affecting the markets directly or indirectly. The article deals with price velocity measurement methods and studies trading strategies based on that methods.
After the upgrade of the MATLAB package in 2015, it is necessary to consider a modern way of creating DLL libraries. The article uses a sample predictive indicator to illustrate the peculiarities of linking MetaTrader 5 and MATLAB using modern 64-bit versions of the platforms, which are utilized nowadays. With the entire sequence of connecting MATLAB considered, MQL5 developers will be able to create applications with advanced computational capabilities much faster, avoiding «pitfalls».
Most of traders agree that the current market state analysis starts with the evaluation of higher chart timeframes. The analysis is performed downwards to lower timeframes until the one, at which deals are performed. This analysis method seems to be a mandatory part of professional approach for successful trading. In this article, we will discuss multi-timeframe indicators and their creation ways, as well as we will provide MQL5 code examples. In addition to the general evaluation of advantages and disadvantages, we will propose a new indicator approach using the MTF mode.
When developing trading algorithms, we often encounter a problem: how to determine where a trend/flat begins and ends? In this article, we try to create a universal indicator, in which we try to combine signals for different types of strategies. We will try to simplify the process of obtaining trade signals in an expert as much as possible. An example of combining several indicators in one will be given.
The trade Signals service develops in leaps and bounds. Trusting our funds to a signal provider, we would like to minimize the risk of losing our deposit. So how to puzzle out in this forest of trade signals? How to find the one that would produce profits? This paper proposes to create a tool for visually analyzing the history of trades on trade signals in a symbol chart.
The article demonstrates the development of the ZigZag indicator in accordance with one of the sample specifications described in the article "How to prepare Requirements Specification when ordering an indicator". The indicator is built by extreme values defined using an oscillator. There is an ability to use one of five oscillators: WPR, CCI, Chaikin, RSI or Stochastic Oscillator.
MQL programming language allows implementing the concept of modular development of trading strategies. The article shows an example of developing a multi-module Expert Advisor consisting of separately compiled file modules.
When making trading decisions, we often have to analyze charts on several timeframes. At the same time, these charts often contain graphical objects. Applying the same objects to all charts is inconvenient. In this article, I propose to automate cloning of objects to be displayed on charts.