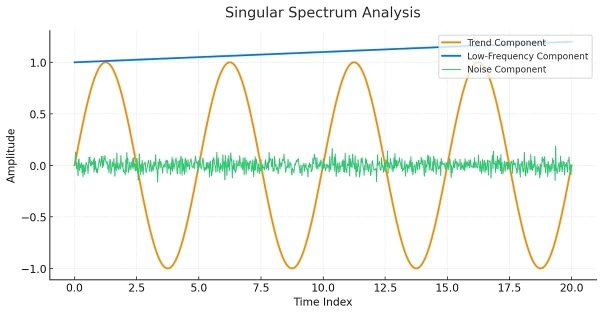
This article is meant as a guide for those unfamiliar with the concept of Singular Spectrum Analysis and who wish to gain enough understanding to be able to apply the built-in tools available in MQL5.
Automating price action analysis is the way forward. In this article, we utilize the Dual CCI indicator, the Zero Line Crossover strategy, EMA, and price action to develop a tool that generates trade signals and sets stop-loss (SL) and take-profit (TP) levels using ATR. Please read this article to learn how we approach the development of the CCI Zero Line EA.
Using simple examples, we will examine the principles of calculating moving averages, as well as learn about the ways to optimize indicator calculations, including moving averages.
At the start of each trading session, the market’s directional bias often becomes clear only after price moves beyond the opening range. In this article, we explore how to build an MQL5 Expert Advisor that automatically detects and analyzes Opening Range Breakouts, providing you with timely, data‑driven signals for confident intraday entries.
In this article, we will consider creating an indicator that displays trading statistics on a dashboard by account and by symbols and trading strategies. We will implement the code based on examples from the Documentation and the article on working with databases.
Understanding the subtle dynamics behind price movements can give you a critical edge. One such phenomenon is the liquidity sweep, a deliberate strategy that large traders, especially institutions, use to push prices through key support or resistance levels. These levels often coincide with clusters of retail stop-loss orders, creating pockets of liquidity that big players can exploit to enter or exit sizeable positions with minimal slippage.
Aligned with our goal of developing practical price-action tools, this article explores the creation of an EA that detects pin bar and engulfing patterns, using RSI divergence as a confirmation trigger before generating any trading signals.
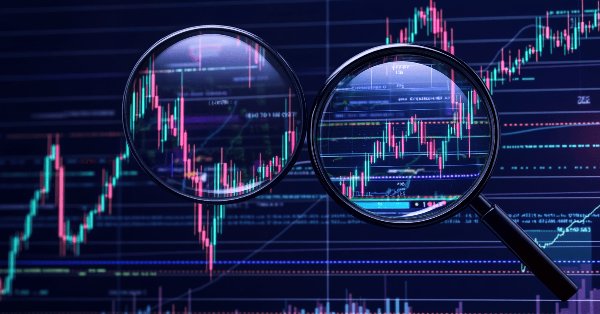
Price action is a fundamental approach for identifying profitable trading setups. However, manually monitoring price movements and patterns can be challenging and time-consuming. To address this, we are developing tools that analyze price action automatically, providing timely signals whenever potential opportunities are detected. This article introduces a robust tool that leverages fractal breakouts alongside EMA 14 and EMA 200 to generate reliable trading signals, helping traders make informed decisions with greater confidence.
Geometric patterns offer traders a concise way to interpret price action. Many analysts draw trend lines, rectangles, and other shapes by hand, and then base trading decisions on the formations they see. In this article, we explore an automated alternative: harnessing MQL5 to detect and analyze the most popular geometric patterns. We’ll break down the methodology, discuss implementation details, and highlight how automated pattern recognition can sharpen a trader's market insights.
Candlestick patterns offer valuable insights into potential market moves. Some single candles signal continuation of the current trend, while others foreshadow reversals, depending on their position within the price action. This article introduces an EA that automatically identifies four key candlestick formations. Explore the following sections to learn how this tool can enhance your price-action analysis.
Do you know what really drives a currency pair’s direction? It’s the strength of each individual currency. In this article, we’ll measure a currency’s strength by looping through every pair it appears in. That insight lets us predict how those pairs may move based on their relative strengths. Read on to learn more.
An MQL5 framework that brings institutional-grade execution algorithms (TWAP, VWAP, Iceberg) to retail traders through a unified execution manager and performance analyzer for smoother, more precise order slicing and analytics.
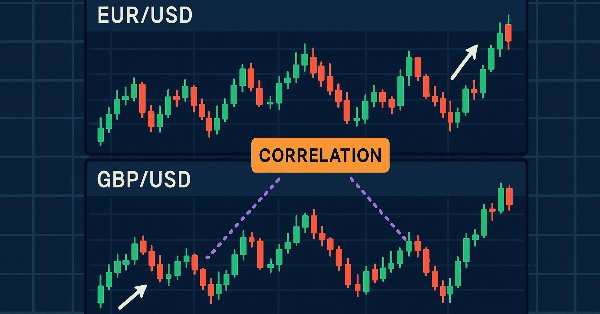
This tool is a Correlation Dashboard that calculates and displays real-time correlation coefficients across multiple currency pairs. By visualizing how pairs move in relation to one another, it adds valuable context to your price-action analysis and helps you anticipate inter-market dynamics. Read on to explore its features and applications.
The Market Structure Flip Detector Expert Advisor (EA) acts as your vigilant partner, constantly observing shifts in market sentiment. By utilizing Average True Range (ATR)-based thresholds, it effectively detects structure flips and labels each Higher Low and Lower High with clear indicators. Thanks to MQL5’s swift execution and flexible API, this tool offers real-time analysis that adjusts the display for optimal readability and provides a live dashboard to monitor flip counts and timings. Furthermore, customizable sound and push notifications guarantee that you stay informed of critical signals, allowing you to see how straightforward inputs and helper routines can transform price movements into actionable strategies.
In this article, we take the first step in MQL5 programming, even for complete beginners. We'll show you how to transform familiar candlestick patterns into a fully functional custom indicator. Candlestick patterns are valuable as they reflect real price action and signal market shifts. Instead of manually scanning charts—an approach prone to errors and inefficiencies—we'll discuss how to automate the process with an indicator that identifies and labels patterns for you. Along the way, we’ll explore key concepts like indexing, time series, Average True Range (for accuracy in varying market volatility), and the development of a custom reusable Candlestick Pattern library for use in future projects.
Correlation Pathfinder offers a fresh approach to understanding currency pair dynamics as part of the Price Action Analysis Toolkit Development Series. This tool automates data collection and analysis, providing insight into how pairs like EUR/USD and GBP/USD interact. Enhance your trading strategy with practical, real-time information that helps you manage risk and spot opportunities more effectively.
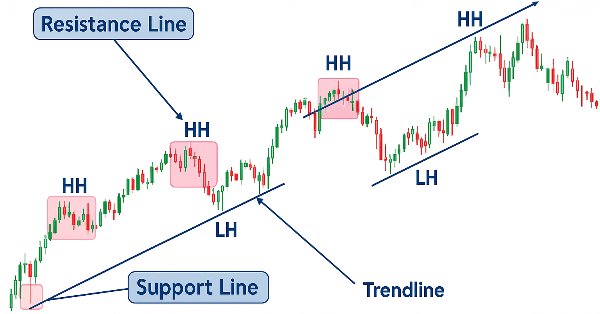
In this article, you'll learn how to build a price action indicator in MQL5, focusing on key points like low (L), high (H), higher low (HL), higher high (HH), lower low (LL), and lower high (LH) for analyzing trends. You'll also explore how to identify the premium and discount zones, mark the 50% retracement level, and use the risk-reward ratio to calculate profit targets. The article also covers determining entry points, stop loss (SL), and take profit (TP) levels based on the trend structure.
Depth of Market is undoubtedly a very important element for executing fast trades, especially in High Frequency Trading (HFT) algorithms. In this series of articles, we will look at this type of trading events that can be obtained through a broker on many tradable symbols. We will start with an indicator, where you can customize the color palette, position and size of the histogram displayed directly on the chart. We will also look at how to generate BookEvent events to test the indicator under certain conditions. Other possible topics for future articles include how to store price distribution data and how to use it in a strategy tester.
Every price action trader manually uses trendlines to confirm trends and spot potential turning or continuation levels. In this series on developing a price action analysis toolkit, we introduce a tool focused on drawing slanted trendlines for easy market analysis. This tool simplifies the process for traders by clearly outlining key trends and levels essential for effective price action evaluation.
In this article, I will describe how to make a simple panel to change the indicator settings directly from the chart, and what changes need to be made to the indicator to connect the panel. This article is intended for novice MQL5 users.
Learn to build a Harmonic Pattern indicator in MQL5 using chart objects. Discover how to detect swing points, apply Fibonacci retracements, and automate pattern recognition.
In this article, we enhance the original Quarters Script by introducing the Quarters Board, a tool that lets you toggle quarter levels directly on the chart without needing to revisit the code. You can easily activate or deactivate specific levels, and the EA also provides trend direction commentary to help you better understand market movements.
In this article, we will share insights on how to leverage MQL5 programming to pinpoint market levels—differentiating between weaker and strongest price levels. We will fully develop a working, Support and Resistance Strength Indicator (SRSI).
As a price action observer and trader, I've noticed that when a trend is confirmed by multiple timeframes, it usually continues in that direction. What may vary is how long the trend lasts, and this depends on the type of trader you are, whether you hold positions for the long term or engage in scalping. The timeframes you choose for confirmation play a crucial role. Check out this article for a quick, automated system that helps you analyze the overall trend across different timeframes with just a button click or regular updates.
Cycles are of great importance in our lives. Day and night, seasons, days of the week and many other cycles of different nature are present in the life of any person. In this article, we will consider cycles in financial markets.
This article guides you through building a custom Heikin Ashi indicator from scratch and demonstrates how to integrate custom indicators into an EA. It covers indicator calculations, trade execution logic, and risk management techniques to enhance automated trading strategies.
We will create an indicator based on the Gann's Square of 9, built by squaring time and price. We will prepare the code and test the indicator in the platform on different time intervals.
Price action can be effectively analyzed by identifying divergences, with technical indicators such as the RSI providing crucial confirmation signals. In the article below, we explain how automated RSI divergence analysis can identify trend continuations and reversals, thereby offering valuable insights into market sentiment.
In this article, we build a Keltner Channel indicator with custom canvas graphics in MQL5. We detail the integration of moving averages, ATR calculations, and enhanced chart visualization. We also cover backtesting to evaluate the indicator’s performance for practical trading insights.
Learn how to build a custom indicator in MQL5. With a project-based approach. This beginner-friendly guide covers indicator buffers, properties, and trend visualization, allowing you to learn step-by-step.
In this article, we will look at a non-standard way of creating an indicator in MQL5. Instead of focusing on a trend or chart pattern, our goal will be to manage our own positions, including partial entries and exits. We will make extensive use of dynamic matrices and some trading functions related to trade history and open positions to indicate on the chart where these trades were made.
We continue our dive into chaos theory in financial markets. This time I will consider its applicability to the analysis of currencies and other assets.
Master the power of VWAP with our comprehensive guide! Learn how to integrate VWAP analysis into your trading strategy using MQL5 and Python. Maximize your market insights and improve your trading decisions today.
Discover how to develop an Expert Advisor (EA) in MQL5 using multiple indicators like RSI, MA, and Stochastic Oscillator to detect hidden bullish and bearish divergences. Learn to implement effective risk management and automate trades with detailed examples and fully commented source code for educational purposes!
While some concepts may seem straightforward at first glance, bringing them to life in practice can be quite challenging. In the article below, we'll take you on a journey through our innovative approach to automating an Expert Advisor (EA) that skillfully analyzes the market using a mean reversion strategy. Join us as we unravel the intricacies of this exciting automation process.
This article focuses on essential MQL5 file-handling techniques, spanning trade logs, CSV processing, and external data integration. It offers both conceptual understanding and hands-on coding guidance. Readers will learn to build a custom CSV importer class step-by-step, gaining practical skills for real-world applications.
Moving from a simple trading script to a fully functioning Expert Advisor (EA) can significantly enhance your trading experience. Imagine having a system that automatically monitors your charts, performs essential calculations in the background, and provides regular updates every two hours. This EA would be equipped to analyze key metrics that are crucial for making informed trading decisions, ensuring that you have access to the most current information to adjust your strategies effectively.
This project aims to leverage the MQL5 algorithm to develop a comprehensive set of analysis tools for MetaTrader 5. These tools—ranging from scripts and indicators to AI models and expert advisors—will automate the market analysis process. At times, this development will yield tools capable of performing advanced analyses with no human involvement and forecasting outcomes to appropriate platforms. No opportunity will ever be missed. Join me as we explore the process of building a robust market analysis custom tools' chest. We will begin by developing a simple MQL5 program that I have named, Chart Projector.
Problem-solving can establish a concise routine for mastering complex skills, such as programming in MQL5. This approach allows you to concentrate on solving problems while simultaneously developing your skills. The more problems you tackle, the more advanced expertise is transferred to your brain. Personally, I believe that debugging is the most effective way to master programming. Today, we will walk through the code-cleaning process and discuss the best techniques for transforming a messy program into a clean, functional one. Read through this article and uncover valuable insights.