In this article, we will continue our series about designing a trading system using the most popular indicators and we will talk about the average directional index (ADX) indicator. We will learn this indicator in detail to understand it well and we will learn how we to use it through a simple strategy. By learning something deeply we can get more insights and we can use it better.
In this article, we continue our learning series — this time we will learn how to design a trading system using one of the most popular and useful indicators, which is the Stochastic Oscillator indicator, to build a new block in our knowledge of basics.
In this article, we will learn a new tool from our series: we will learn how to design a trading system based on one of the most popular technical indicators Moving Average Convergence Divergence (MACD).
Today we will learn how to add multiple indicators running simultaneously on one chart, but without occupying a separate area on it. Many traders feel more confident if they monitor multiple indicators at a time (for example, RSI, STOCASTIC, MACD, ADX and some others), or in some cases even at different assets which an index is made of.
In this new article from our series for learning how to design trading systems, I will present the Commodities Channel Index (CCI), explain its specifics, and share with you how to create a trading system based on this indicator.
In my previous article, I mentioned the importance of identifying the trend which is the direction of prices. In this article I will share one of the most important concepts and indicators which is the Momentum indicator. I will share how to design a trading system based on this Momentum indicator.
In this article, I will share with you one of the most popular and commonly used indicators in the world of trading which is RSI. You will learn how to design a trading system using this indicator.
In this article, I will share with you one of the methods of how to trade bands. This time we will consider Envelopes and will see how easy it is to create some strategies based on the Envelopes.
In this article, we will learn about Bollinger Bands which is one of the most popular indicators in the trading world. We will consider technical analysis and see how to design an algorithmic trading system based on the Bollinger Bands indicator.
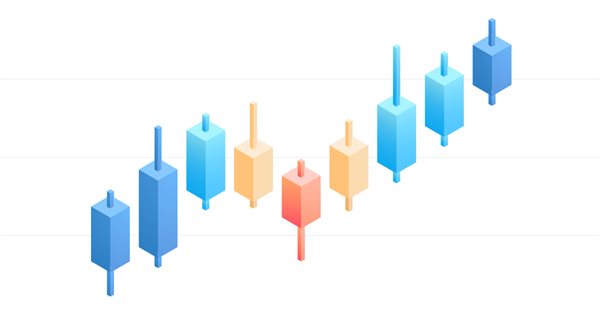
How to find more candlestick patterns than usual? Behind the simplicity of candlestick patterns, there is also a serious drawback, which can be eliminated by using the significantly increased capabilities of modern trading automation tools.
There are many strategies that can be used to filter generated signals based on any strategy, even by using the moving average itself which is the subject of this article. So, the objective of this article is to share with you some of Moving Average Strategies and how to design an algorithmic trading system.
This article is a logical continuation of the previous one. It highlights the facts that confirm the conclusions made in the first article. These facts were revealed within ten years after its publication. They are centered around three detected dynamic transient functions describing the patterns in market price changes.
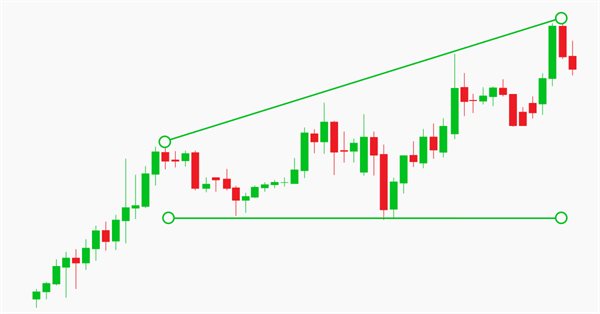
In this article, we will further develop the idea of drawing graphical objects on charts using keyboard shortcuts. New tools have been added to the library, including a straight line plotted through arbitrary vertices, and a set of rectangles that enable the evaluation of the reversal time and level. Also, the article shows the possibility to optimize code for improved performance. The implementation example has been rewritten, allowing the use of Shortcuts alongside other trading programs. Required code knowledge level: slightly higher than a beginner.
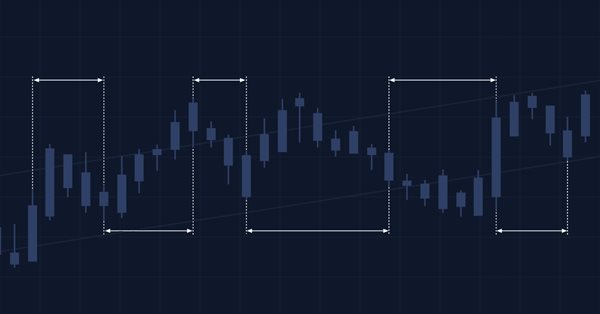
Functions and code snippets that simplify and clarify the handling of time, broker offset, and the changes to summer or winter time. Accurate timing may be a crucial element in trading. At the current hour, is the stock exchange in London or New York already open or not yet open, when does the trading time for Forex trading start and end? For a trader who trades manually and live, this is not a big problem.
An indicator to report your brokers Bid/Ask spread levels. Now we can use MT5s tick data to analyze what the historic true average Bid/Ask spread actually have recently been. You shouldn't need to look at the current spread because that is available if you show both bid and ask price lines.
This is the first article in a series related to reversal patterns in the framework of algorithmic trading. We will begin with the most interesting pattern family, which originate from the Double Top and Double Bottom patterns.
This is the must read article for anyone wanting to improve their programming career. This article series is aimed at making you the best programmer you can possibly be, no matter how experienced you are. The discussed ideas work for MQL5 programming newbies as well as professionals.
Cluster analysis is one of the most important elements of artificial intelligence. In this article, I attempt applying the cluster analysis of the indicator slope to get threshold values for determining whether a market is flat or following a trend.
Thomas DeMark Sequential is good at showing balance changes in the price movement. This is especially evident if we combine its signals with a level indicator, for example, Murray levels. The article is intended mostly for beginners and those who still cannot find their "Grail". I will also display some features of building levels that I have not seen on other forums. So, the article will probably be useful for advanced traders as well... Suggestions and reasonable criticism are welcome...
The article considers creation of an abstract indicator which further will be used as the base class to create objects of library’s standard and custom indicators.
In the article, consider creation of multi-symbol multi-period standard indicator Accumulation/Distribution. Slightly improve library classes with respect to indicators so that, the programs developed for outdated platform MetaTrader 4 based on this library could work normally when switching over to MetaTrader 5.
In the article, complete development of objects of multi-period multi-symbol standard indicators. Using Ichimoku Kinko Hyo standard indicator example, analyze creation of compound custom indicators which have auxiliary drawn buffers for displaying data on the chart.
In the article, let’s improve library methods for correct display of multi-symbol multi-period standard indicators, which lines are displayed on the current symbol chart with a shift set in the settings. As well, let’s put things in order in methods of work with standard indicators and remove the redundant code to the library area in the final indicator program.
Traders often talk about trends and flats but very few of them really understand what a trend/flat really is and even fewer are able to clearly explain these concepts. Discussing these basic terms is often beset by a solid set of prejudices and misconceptions. However, if we want to make profit, we need to understand the mathematical and logical meaning of these concepts. In this article, I will take a closer look at the essence of trend and flat, as well as try to define whether the market structure is based on trend, flat or something else. I will also consider the most optimal strategies for making profit on trend and flat markets.
In the current article, I will improve the library classes to implement the ability to develop multi-symbol multi-period standard indicators requiring several indicator buffers to display their data.
The article considers an example of creating multi-symbol multi-period standard indicators using a single indicator buffer for construction and working in the indicator subwindow. I am going to prepare the library classes for working with standard indicators working in the program main window and having more than one buffer for displaying their data.
In this article, I will start developing the methods of working with standard indicators, which will ultimately allow creating multi-symbol multi-period standard indicators based on library classes. Besides, I will add the "Skipped bars" event to the timeseries classes and eliminate excessive load from the main program code by moving the library preparation functions to CEngine class.
In this article, we consider the principles of mathematical expression parsing and evaluation using parsers based on operator precedence. We will implement Pratt and shunting-yard parser, byte-code generation and calculations by this code, as well as view how to use indicators as functions in expressions and how to set up trading signals in Expert Advisors based on these indicators.
In this article, I will start the improvement of the indicator buffer objects and collection class for working in multi-period and multi-symbol modes. I am going to consider the operation of buffer objects for receiving and displaying data from any timeframe on the current symbol chart.
This is the first article in a series, in which I am going to describe a toolkit which enables manual application of chart graphics by utilizing keyboard shortcuts. It is very convenient: you press one key and a trendline appears, you press another key — this will create a Fibonacci fan with the necessary parameters. It will also be possible to switch timeframes, to rearrange layers or to delete all objects from the chart.
The article deals with creating a collection class of indicator buffer objects. I am going to test the ability to create and work with any number of buffers for indicators (the maximum number of buffers that can be created in MQL indicators is 512).
The article considers the development of indicator buffer object classes as descendants of the abstract buffer object simplifying declaration and working with indicator buffers, while creating custom indicator programs based on DoEasy library.
In the fifth article related to the creation of a trading signal monitor, we will consider composite signals and will implement the necessary functionality. In earlier versions, we used simple signals, such as RSI, WPR and CCI, and we also introduced the possibility to use custom indicators.
In this article, we start the development of the indicator buffer classes for the DoEasy library. We will create the base class of the abstract buffer which is to be used as a foundation for the development of different class types of indicator buffers.
In this part, we expand the trading signal searching and editing system, as well as introduce the possibility to use custom indicators and add program localization. We have previously created a basic system for searching signals, but it was based on a small set of indicators and a simple set of search rules.
In the previous article, we developed the visual part of the application, as well as the basic interaction of GUI elements. This time we are going to add internal logic and the algorithm of trading signal data preparation, as well us the ability to set up signals, to search them and to visualize them in the monitor.
This article deals with the theory and practical application of the algorithm for forecasting time series, based on support-vector method. It also proposes its implementation in MQL and provides test indicators and Expert Advisors. This technology has not been implemented in MQL yet. But first, we have to get to know math for it.
This article deals with the theory and practical use of the algorithm for forecasting time series, based on the empirical decomposition mode. It proposes the MQL implementation of this method and presents test indicators and Expert Advisors.
In the previous article, we created the application framework, which we will use as the basis for all further work. In this part, we will proceed with the development: we will create the visual part of the application and will configure basic interaction of interface elements.