Variables and data types are very important topics not only in MQL5 programming but also in any programming language. MQL5 variables and data types can be categorized as simple and advanced ones. In this article, we will identify and learn about advanced ones because we already mentioned simple ones in a previous article.
In this article, we will look at the principles of creating multi-symbol, multi-period indicators. We will also see how to access the data of such indicators from Expert Advisors and other indicators. We will consider the main features of using multi-indicators in Expert Advisors and indicators and will see how to plot them through custom indicator buffers.
We are all familiar with the concept of seasonality, for example, we are all accustomed to rising prices for fresh vegetables in winter or rising fuel prices during severe frosts, but few people know that similar patterns exist in the Forex market.
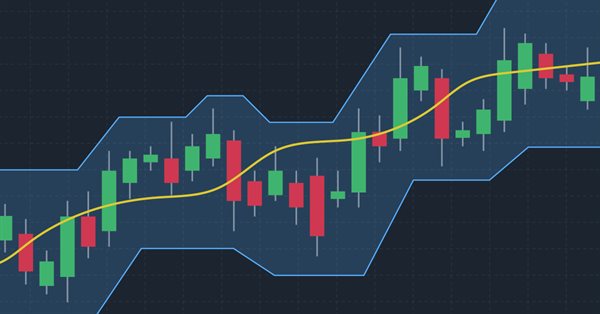
In this article, we will try to provide trading systems using a very important concept in the financial market which is volatility. We will provide a trading system based on the Keltner Channel indicator after understanding it and how we can code it and how we can create a trading system based on a simple trading strategy and then test it on different assets.
In this article, we will consider pair trading, namely what its principles are and if there are any prospects for its practical application. We will also try to create a pair trading strategy.
In this article, we will learn how we can build an Aroon trading system after learning the basics of the indicators and the needed steps to build a trading system based on the Aroon indicator. After building this trading system, we will test it to see if it can be profitable or needs more optimization.
In this article, we will complete our series about the Design Patterns topic, we mentioned that there are three types of design patterns creational, structural, and behavioral. We will complete the remaining patterns of the behavioral type which can help set the method of interaction between objects in a way that makes our code clean.
Obviously the current metrics are very far from the ideal time for creating a 1-minute bar. That's the first thing we are going to fix. Fixing the synchronization problem is not difficult. This may seem hard, but it's actually quite simple. We did not make the required correction in the previous article since its purpose was to explain how to transfer the tick data that was used to create the 1-minute bars on the chart into the Market Watch window.
A new article from Design Patterns articles and we will take a look at one of its types which is behavioral patterns to understand how we can build communication methods between created objects effectively. By completing these Behavior patterns we will be able to understand how we can create and build a reusable, extendable, tested software.
In this article, we will continue our articles about Design Patterns after learning how much this topic is more important for us as developers to develop extendable, reliable applications not only by the MQL5 programming language but others as well. We will learn about another type of Design Patterns which is the structural one to learn how to design systems by using what we have as classes to form larger structures.
Within the framework of the engineering approach developed by the author based on the probability theory, the conditions for opening a profitable position are found and the optimal (profit-maximizing) take profit and stop loss values are calculated.
There are methods that can be used to solve many problems that can be repeated. Once understand how to use these methods it can be very helpful to create your software effectively and apply the concept of DRY ((Do not Repeat Yourself). In this context, the topic of Design Patterns will serve very well because they are patterns that provide solutions to well-described and repeated problems.
In this article, we will consider one of the methods of spectral analysis and signal processing - the discrete Hartley transform. It allows filtering signals, analyzing their spectrum and much more. The capabilities of DHT are no less than those of the discrete Fourier transform. However, unlike DFT, DHT uses only real numbers, which makes it more convenient for implementation in practice, and the results of its application are more visual.
A new article about a new important topic which is dealing with date and time. As traders or programmers of trading tools, it is very crucial to understand how to deal with these two aspects date and time very well and effectively. So, I will share some important information about how we can deal with date and time to create effective trading tools smoothly and simply without any complicity as much as I can.
In this article we explore the practical implementation of elastic net regression to minimize overfitting and at the same time automatically separate useful predictors from those that have little prognostic power.
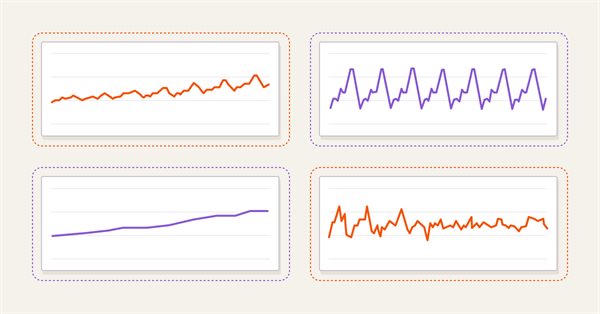
We all know the importance of the Moving Average indicator for a lot of traders. There are other Moving average types that can be useful in trading, we will identify these types in this article and make a simple comparison between each one of them and the most popular simple Moving average type to see which one can show the best results.
Join us in Part III of the "Improve Your Trading Charts With Interactive GUIs in MQL5" series as we explore the integration of interactive GUIs into movable trading dashboards in MQL5. This article builds on the foundations set in Parts I and II, guiding readers to transform static trading dashboards into dynamic, movable ones.
Any Program in any programming language has a specific structure. In this article, you will learn essential parts of the MQL5 program structure by understanding the programming basics of every part of the MQL5 program structure that can be very helpful when creating our MQL5 trading system or trading tool that can be executable in the MetaTrader 5.
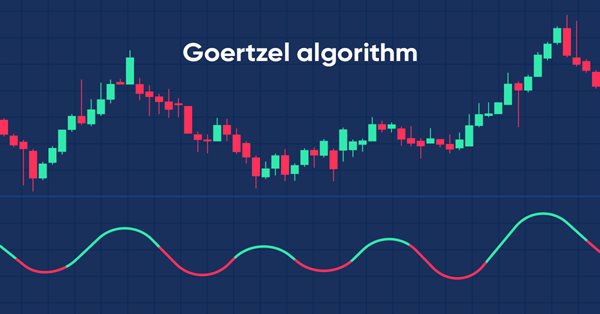
In this article we present code utilities that implement the goertzel algorithm in Mql5 and explore two ways in which the technique can be used in the analysis of price quotes for possible strategy development.
Functions are critical things in any programming language, it helps developers apply the concept of (DRY) which means do not repeat yourself, and many other benefits. In this article, you will find much more information about functions and how we can create our own functions in MQL5 with simple applications that can be used or called in any system you have to enrich your trading system without complicating things.
In this article, we will provide a simple and easy guide to anyone who needs to create one of the most valuable and helpful tools in trading which is the graphical panel to simplify and ease doing tasks around trading which helps to save time and focus more on your trading process itself without any distractions.
Unlock the potential of dynamic data representation in your trading strategies and utilities with our in-depth guide to creating movable GUIs in MQL5. Delve into the fundamental principles of object-oriented programming and discover how to design and implement single or multiple movable GUIs on the same chart with ease and efficiency.
This article reports the first attempts in the development of a native MQTT client for MQL5. MQTT is a Client Server publish/subscribe messaging transport protocol. It is lightweight, open, simple, and designed to be easy to implement. These characteristics make it ideal for use in many situations.
As developers, we need to learn how to create and develop software that can be reusable and flexible without duplicated code especially if we have different objects with different behaviors. This can be smoothly done by using object-oriented programming techniques and principles. In this article, we will present the basics of MQL5 Object-Oriented programming to understand how we can use principles and practices of this critical topic in our software.
This article continues the series on category theory implementation in MQL5. Here we look at monoid-groups as a means normalising monoid sets making them more comparable across a wider span of monoid sets and data types..
Unleash the power of dynamic data representation in your trading strategies or utilities with our comprehensive guide on creating movable GUI in MQL5. Dive into the core concept of chart events and learn how to design and implement simple and multiple movable GUI on the same chart. This article also explores the process of adding elements to your GUI, enhancing their functionality and aesthetic appeal.
There are many technical tools that can be used to visualize a channel surrounding prices, One of these tools is the Donchian Channel indicator. In this article, we will learn how to create the Donchian Channel indicator and how we can trade it as a custom indicator using EA.
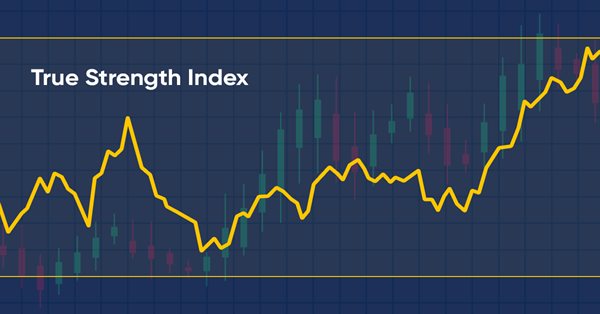
Here is a new article about how to create a custom indicator. This time we will work with the True Strength Index (TSI) and will create an Expert Advisor based on it.
Gary Anderson developed a method of market analysis based on a theory he dubbed the Janus Factor. The theory describes a set of indicators that can be used to reveal trends and assess market risk. In this article we will implement these tools in mql5.
In this article I'll introduce a method for creating custom indicators whose drawings are made using the class CCanvas from standard library and see charts properties for coordinates conversion. I'll approach specially indicators which need to fill the area between two lines using transparency.
My strategy is based on the classic trading fundamentals and the refinement of indicators that are widely used in all types of markets. This is a ready-made tool allowing you to follow the proposed new profitable trading strategy.
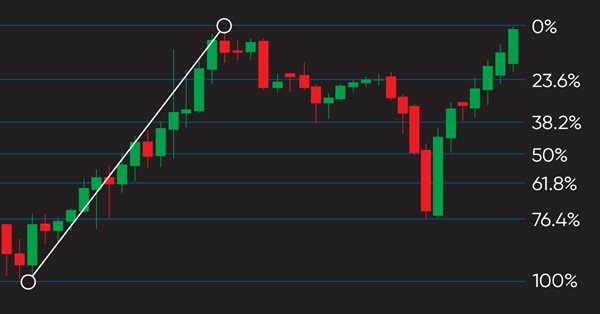
In this article, we will continue our series of creating a trading system based on the most popular technical indicator. Here is a new technical tool which is the Fibonacci and we will learn how to design a trading system based on this technical indicator.
This is a new article in the series in which we learn how to design a trading system based on popular technical indicators. This time we will cover Bill Williams' Market Facilitation Index (BW MFI).
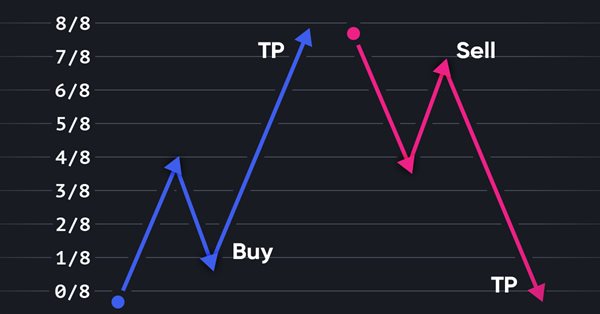
Graphical price analysis systems are deservedly popular among traders. In this article, I am going to describe the complete Murray system, including its famous levels, as well as some other useful techniques for assessing the current price position and making a trading decision.
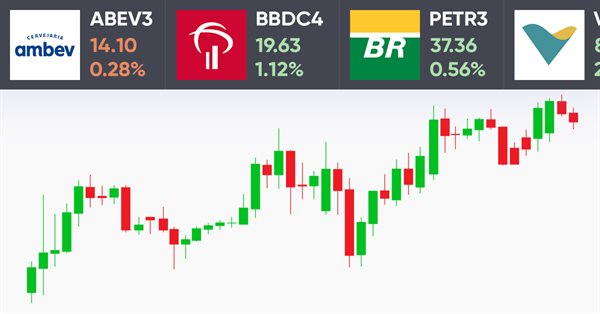
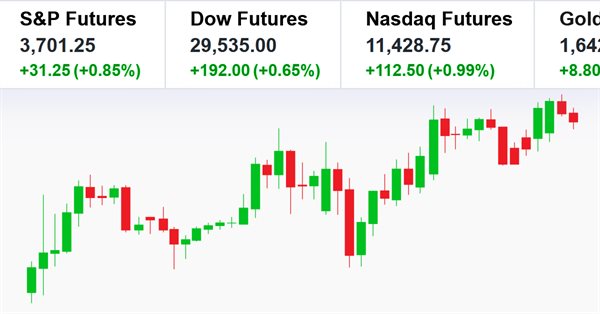
How do you like the idea of reviving the basic version of our ticker tape panel? The first thing we will do is change the panel to be able to add an image, such as an asset logo or some other image, so that the user could quickly and easily identify the displayed symbol.
Here I will show how to create screens with price tickers which are usually used to display quotes on the exchange. I will do it by only using MQL5, without using complex external programming.
In this article, I will make an attempt to consider some ways of building non-linear indicators and their use in trading. There are quite a few indicators in the MetaTrader trading platform that use non-linear approaches.