A new article in our series about learning how to design a trading system based on popular technical indicators will be about the Gator Oscillator technical indicator and how to create a trading system through simple strategies.
How do you like the idea of adding a new chart type to the MetaTrader 5 platform? Some people say it lacks a few things that other platforms offer. But the truth is, MetaTrader 5 is a very practical platform as it allows you to do things that can't be done (or at least can't be done easily) in many other platforms.
Category Theory is a diverse and expanding branch of Mathematics which as of yet is relatively uncovered in the MQL community. These series of articles look to introduce and examine some of its concepts with the overall goal of establishing an open library that attracts comments and discussion while hopefully furthering the use of this remarkable field in Traders' strategy development.
We continue to remove separate parts from our EA. This is the last article within this series. And the last thing to be removed is the sound system. This can be a bit confusing if you haven't followed these article series.
In this article, I will consider several possible approaches to creating adaptive indicators. Adaptive indicators are distinguished by the presence of feedback between the values of the input and output signals. This feedback allows the indicator to independently adjust to the optimal processing of financial time series values.
This article is a new one from our series about how to design a trading system based on the most popular technical indicators. We will learn a new indicator which Fractals indicator and we will learn how to design a trading system based on it to be executed in the MetaTrader 5 terminal.
In this article, I will consider the algorithms allowing you to create your own technical indicator. You will learn how to obtain pretty complex and interesting results with very simple initial assumptions.
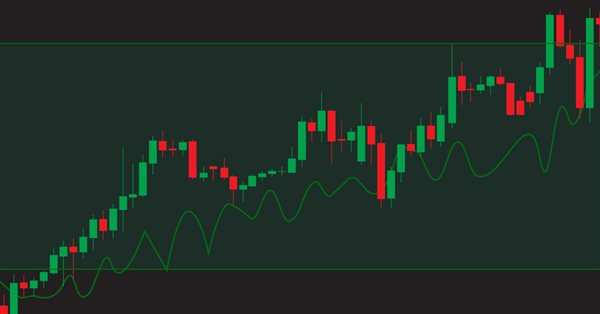
In this article, we'll complete our series about how to design a trading system based on the most popular technical indicator. We'll learn how to create a trading system based on the Alligator indicator.
In this article, I will make additional changes to the CCI affecting the very logic of this indicator. Moreover, we will be able to see it in the main chart window.
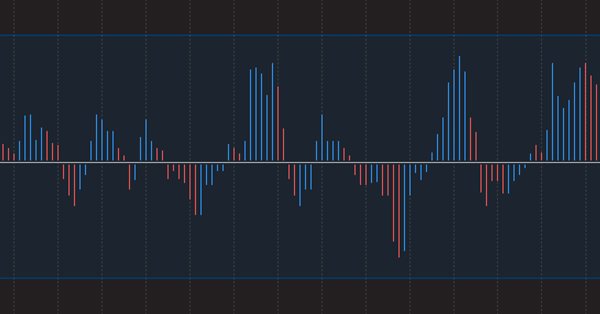
A new article from our series about how to create simple trading systems by the most popular technical indicators. We will learn about a new one which is the Accelerator Oscillator indicator and we will learn how to design a trading system using it.
In this new article in our series, we will learn about a new technical tool that may be useful in our trading. It is the Awesome Oscillator (AO) indicator. We will learn how to design a trading system by this indicator.
A new article in our series about how to design a trading system by the most popular technical indicator. In this article, we will learn how to do that by the Relative Vigor Index indicator.
Here is a new article in our series about how to design a trading system by the most popular technical indicators. In this article, we will present how to create a trading system by the DeMarker indicator.
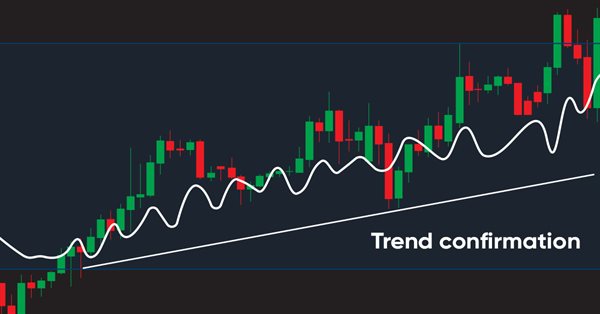
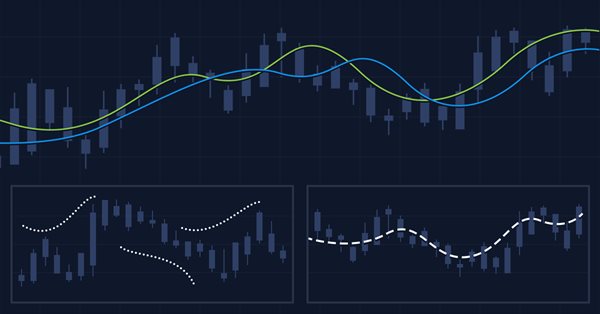
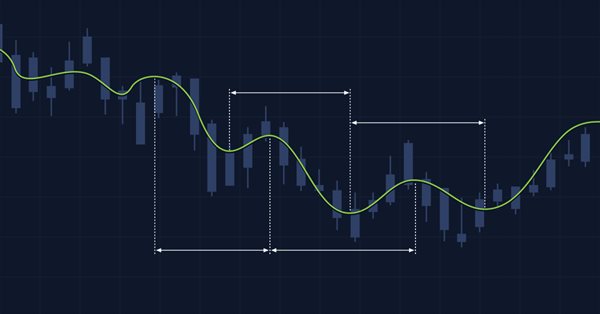
Welcome to a new article from our series about learning how to design a trading system by the most popular technical indicators, in this article we will learn about a new technical tool and learn how to design a trading system by Variable Index Dynamic Average (VIDYA).
Welcome to a new article in our series about learning how to design a trading system by the most popular technical indicator as we will learn in this article about a new technical indicator and how we can design a trading system by it and this indicator is the Bull's Power indicator.
Welcome to a new article in our series about learning how to design a trading system by the most popular technical indicator here is a new article about learning how to design a trading system by Bear's Power technical indicator.
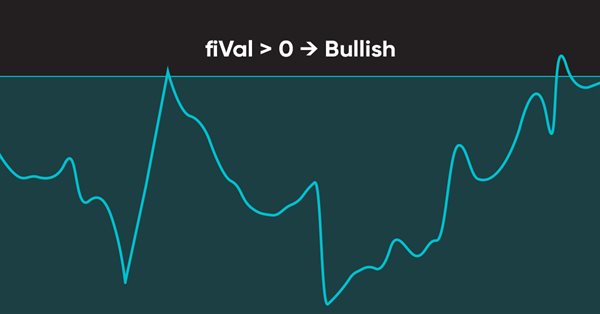
Welcome to a new article in our series about how to design a trading system by the most popular technical indicators. In this article, we will learn about a new technical indicator and how to create a trading system using the Force Index indicator.
This article provides a method to create complex indicators while also avoiding the problems that arise when dealing with multiple plots, buffers and/or combining data from multiple sources.
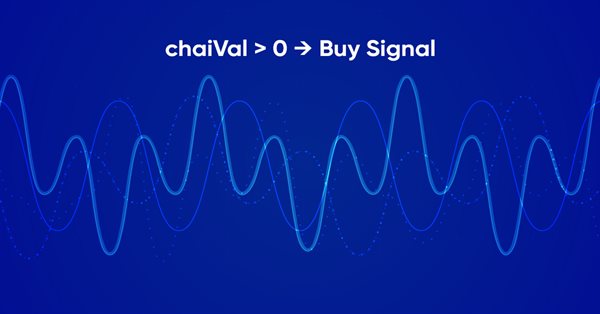
Welcome to our new article from our series about learning how to design a trading system by the most popular technical indicator. Through this new article, we will learn how to design a trading system by the Chaikin Oscillator indicator.
Knowing how to input data from the Web into an Expert Advisor is not so obvious. It is not so easy to do without understanding all the possibilities offered by MetaTrader 5.
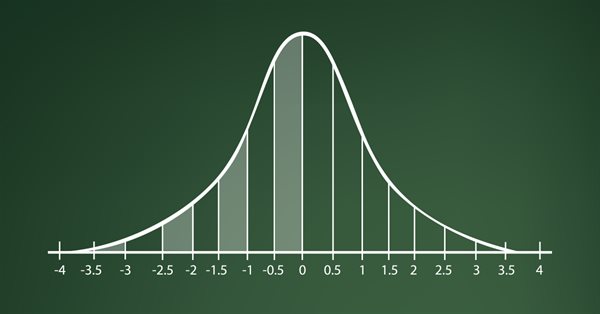
Here is a new article in our series about how to design a trading system by the most popular technical indicators in MetaTrader 5 trading platform. In this new article, we will learn how to design a trading system by Standard Deviation indicator.
How to access online data via MetaTrader 5? There are a lot of websites and places on the web, featuring a huge amount information. What you need to know is where to look and how best to use this information.
Today we will add some more resources to our EA. This interesting article can provide some new ideas and methods of presenting information. At the same time, it can assist in fixing minor flaws in your projects.
A new article in our series about learning how to design a trading system by the most popular technical indicators by MQL5 to be used in the MetaTrader 5. In this article, we will learn how to design a trading system by the Williams' %R indicator.
Today we will construct the second part of the Times & Trade system for market analysis. In the previous article "Times & Trade (I)" we discussed an alternative chart organization system, which would allow having an indicator for the quickest possible interpretation of deals executed in the market.
Today we will create Times & Trade with fast interpretation to read the order flow. It is the first part in which we will build the system. In the next article, we will complete the system with the missing information. To implement this new functionality, we will need to add several new things to the code of our Expert Advisor.
How to access custom indicators directly in an Expert Advisor? A trading EA can be truly useful only if it can use custom indicators; otherwise, it is just a set of codes and instructions.
In this article, we will place Chart Trade in a floating window. In the previous part, we created a basic system which enables the use of templates within a floating window.
Here is a new article in our series about how to design a trading system b the most popular indicators, we will talk about the Ichimoku indicator in detail and how to design a trading system by this indicator.
Here is a new article from our series about learning how to design a trading system based on the most popular technical indicators. The current article will be devoted to the Volumes indicator. Volume as a concept is one of the very important factors in financial markets trading and we have to pay attention to it. Through this article, we will learn how to design a simple trading system by Volumes indicator.
The new article from our series about designing a trading system based on the most popular technical indicators considers a new technical indicator - the Money Flow Index (MFI). We will learn it in detail and develop a simple trading system by means of MQL5 to execute it in MetaTrader 5.
Welcome to the new article from our series about learning how to design trading systems based on the most popular technical indicators. In this article, we will learn about a new technical indicator called Accumulation/Distribution indicator and find out how to design an MQL5 trading system based on simple AD trading strategies.
This is a new article to continue our series for beginners about how to design a trading system based on some of the popular indicators. We will learn a new indicator that is On Balance Volume (OBV), and we will learn how we can use it and design a trading system based on it.
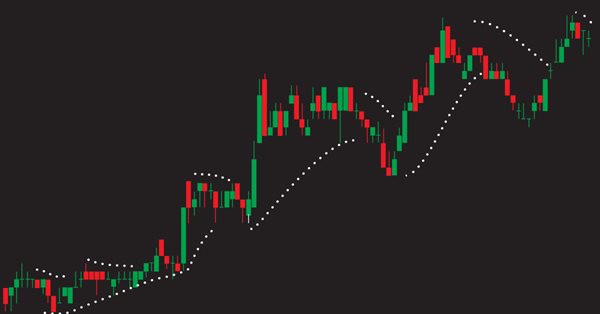
In this article, we will continue our series about how to design a trading system using the most popular indicators. In this article, we will learn about the Parabolic SAR indicator in detail and how we can design a trading system to be used in MetaTrader 5 using some simple strategies.
In my previous articles, I have explained how to create an indicator with multiple subwindows, which becomes interesting when using custom indicators. This time we will see how to add multiple windows to an Expert Advisor.
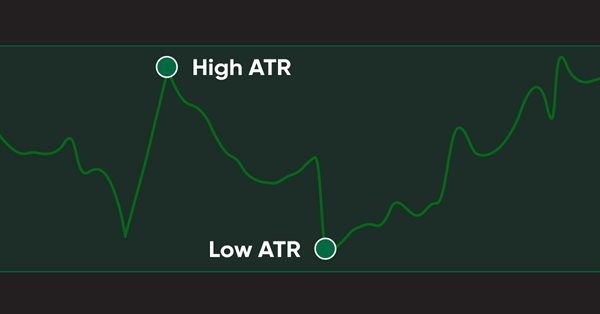
In this article, we will learn a new technical tool that can be used in trading, as a continuation within the series in which we learn how to design simple trading systems. This time we will work with another popular technical indicator: Average True Range (ATR).
Today we will update the functionality of the indicator system for the first time. In the previous article within the "Multiple indicators on one chart" we considered the basic code which allows using more than one indicator in a chart subwindow. But what was presented was just the starting base of a much larger system.
In the previous article "Multiple indicators on one chart" I presented the concept and the basics of how to use multiple indicators on one chart. In this article, I will provide the source code and will explain it in detail.