We commence a new article series that builds upon our earlier efforts laid out in the MQL5 Wizard series, by taking them further as we step up our approach to systematic trading and strategy testing. Within these new series, we’ll concentrate our focus on Expert Advisors that are coded to hold only a single type of position - primarily longs. Focusing on just one market trend can simplify analysis, lessen strategy complexity and expose some key insights, especially when dealing in assets beyond forex. Our series, therefore, will investigate if this is effective in equities and other non-forex assets, where long only systems usually correlate well with smart money or institution strategies.
This article introduces the Triple Sine Mean Reversion Method, a trading strategy built upon a new mathematical indicator — the Triple Sine Oscillator (TSO). The TSO is derived from the sine cube function, which oscillates between –1 and +1, making it suitable for identifying overbought and oversold market conditions. Overall, the study demonstrates how mathematical functions can be transformed into practical trading tools.
This article considers the Rademacher and Walsh functions. We will explore ways to apply these functions to financial time series analysis and also consider various applications for them in trading.
Simplify your MetaTrader 5 charts with the Multi Indicator Handler EA. This interactive dashboard merges trend, momentum, and volatility indicators into one real‑time panel. Switch instantly between profiles to focus on the analysis you need most. Declutter with one‑click Hide/Show controls and stay focused on price action. Read on to learn step‑by‑step how to build and customize it yourself in MQL5.
In this article, we demonstrated how the fascinating mathematical concept of the Butterfly Curve can be transformed into a practical trading tool. We constructed the Butterfly Oscillator and built a foundational trading strategy around it. The strategy effectively combines the oscillator's unique cyclical signals with traditional trend confirmation from moving averages, creating a systematic approach for identifying potential market entries.
Global market sessions shape the rhythm of the trading day, and understanding their overlap is vital to timing entries and exits. In this article, we’ll build an interactive trading sessions EA that brings those global hours to life directly on your chart. The EA automatically plots color‑coded rectangles for the Asia, Tokyo, London, and New York sessions, updating in real time as each market opens or closes. It features on‑chart toggle buttons, a dynamic information panel, and a scrolling ticker headline that streams live status and breakout messages. Tested on different brokers, this EA combines precision with style—helping traders see volatility transitions, identify cross‑session breakouts, and stay visually connected to the global market’s pulse.
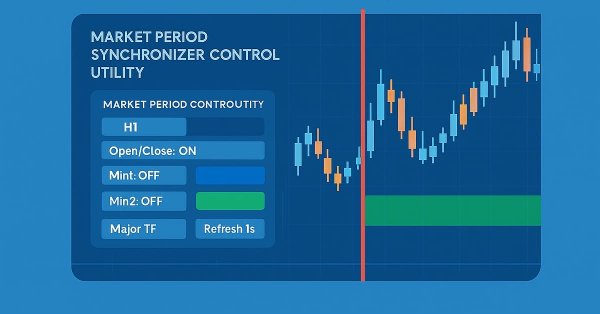
Imagine transforming the traditional EA or indicator input properties into a real-time, on-chart control interface. This discussion builds upon our foundational work in the Market Periods Synchronizer indicator, marking a significant evolution in how we visualize and manage higher-timeframe (HTF) market structures. Here, we turn that concept into a fully interactive utility—a dashboard that brings dynamic control and enhanced multi-period price action visualization directly onto the chart. Join us as we explore how this innovation reshapes the way traders interact with their tools.
The UT BOT ATR Trailing Indicator is a personal and customizable indicator that is very effective for traders who like to make quick decisions and make money from differences in price referred to as short-term trading (scalpers) and also proves to be vital and very effective for long-term traders (positional traders).
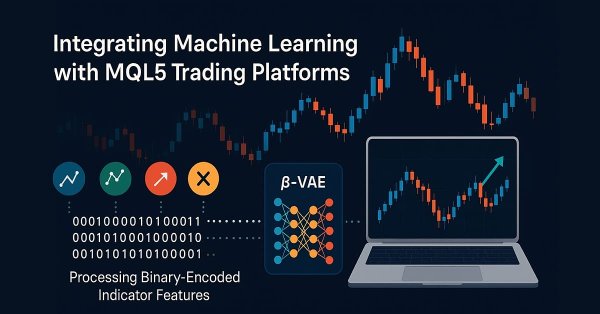
This piece follows up ‘Part-84’, where we introduced the pairing of Stochastic and the Fractal Adaptive Moving Average. We now shift focus to Inference Learning, where we look to see if laggard patterns in the last article could have their fortunes turned around. The Stochastic and FrAMA are a momentum-trend complimentary pairing. For our inference learning, we are revisiting the Beta algorithm of a Variational Auto Encoder. We also, as always, do the implementation of a custom signal class designed for integration with the MQL5 Wizard.
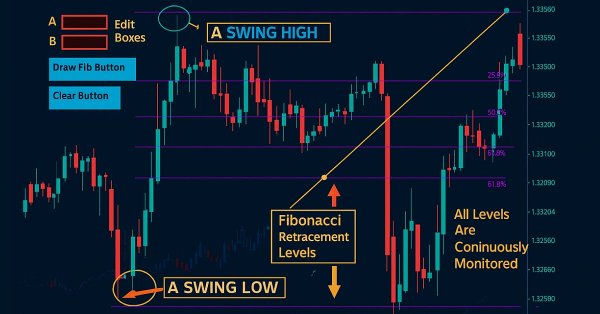
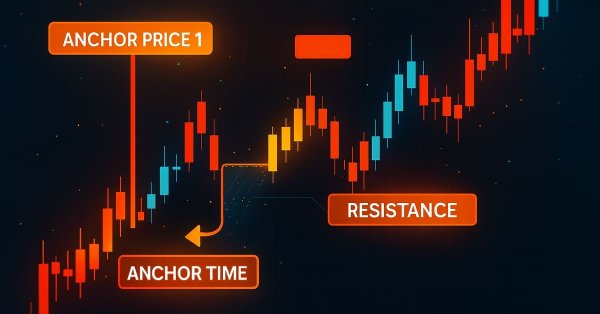
Fibonacci tools are among the most popular instruments used by technical analysts. In this article, we’ll build an Interactive Fibonacci EA that draws retracement and extension levels that react dynamically to price movement, delivering real‑time alerts, stylish lines, and a scrolling news‑style headline. Another key advantage of this EA is flexibility; you can manually type the high (A) and low (B) swing values directly on the chart, giving you exact control over the market range you want to analyze.
This article teaches you how to create an Expert Advisor that detects support and resistance zones drawn on the chart and executes trades automatically based on them.
The Stochastic Oscillator and the Fractal Adaptive Moving Average are an indicator pairing that could be used for their ability to compliment each other within an MQL5 Expert Advisor. We introduced this pairing in the last article, and now look to wrap up by considering its 5 last signal patterns. In exploring this, as always, we use the MQL5 wizard to build and test out their potential.
The Stochastic Oscillator and the Fractal Adaptive Moving Average are another indicator pairing that could be used for their ability to compliment each other within an MQL5 Expert Advisor. We look at the Stochastic for its ability to pinpoint momentum shifts, while the FrAMA is used to provide confirmation of the prevailing trends. In exploring this indicator pairing, as always, we use the MQL5 wizard to build and test out their potential.
In the last article, we examined the pairing of Ichimoku and the ADX under an Inference Learning framework. For this piece we revisit, Reinforcement Learning when used with an indicator pairing we considered last in ‘Part 68’. The TRIX and Williams Percent Range. Our algorithm for this review will be the Quantile Regression DQN. As usual, we present this as a custom signal class designed for implementation with the MQL5 Wizard.
This piece follows up ‘Part-80’, where we examined the pairing of Ichimoku and the ADX under a Reinforcement Learning framework. We now shift focus to Inference Learning. Ichimoku and ADX are complimentary as already covered, however we are going to revisit the conclusions of the last article related to pipeline use. For our inference learning, we are using the Beta algorithm of a Variational Auto Encoder. We also stick with the implementation of a custom signal class designed for integration with the MQL5 Wizard.
In this article, you will learn how to develop an Order Blocks indicator based on order book volume (market depth) and optimize it using buffers to improve accuracy. This concludes the current stage of the project and prepares for the next phase, which will include the implementation of a risk management class and a trading bot that uses signals generated by the indicator.
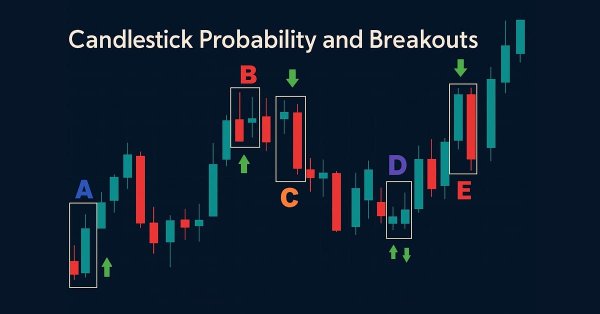
Enhance your market analysis with the MQL5-native Candlestick Probability EA, a lightweight tool that transforms raw price bars into real-time, instrument-specific probability insights. It classifies Pinbars, Engulfing, and Doji patterns at bar close, uses ATR-aware filtering, and optional breakout confirmation. The EA calculates raw and volume-weighted follow-through percentages, helping you understand each pattern's typical outcome on specific symbols and timeframes. On-chart markers, a compact dashboard, and interactive toggles allow easy validation and focus. Export detailed CSV logs for offline testing. Use it to develop probability profiles, optimize strategies, and turn pattern recognition into a measurable edge.
This article explains how to develop a professional Heikin Ashi-based Expert Advisor (EA) in MQL5. You will learn how to set up input parameters, enumerations, indicators, global variables, and implement the core trading logic. You will also be able to run a backtest on gold to validate your work.
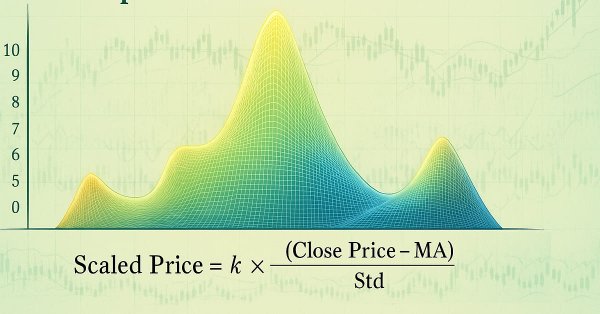
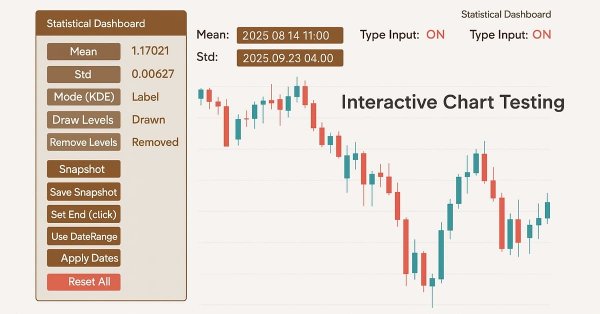
In a world where speed and precision matter, analysis tools need to be as smart as the markets we trade. This article presents an EA built on button logic—an interactive system that instantly transforms raw price data into meaningful statistical levels. With a single click, it calculates and displays mean, deviation, percentiles, and more, turning advanced analytics into clear on-chart signals. It highlights the zones where price is most likely to bounce, retrace, or break, making analysis both faster and more practical.
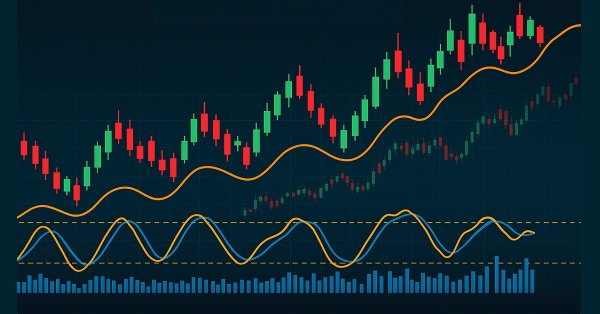
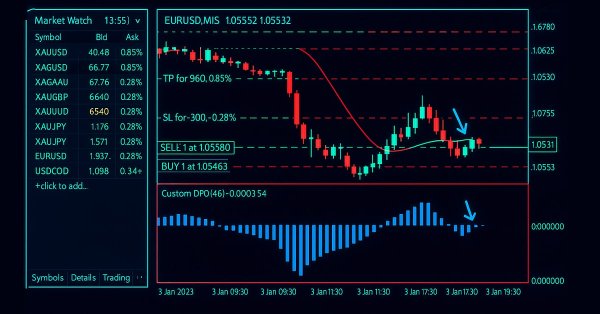
This article explains how to design and optimise a trading system using the Detrended Price Oscillator (DPO) in MQL5. It outlines the indicator's core logic, demonstrating how it identifies short-term cycles by filtering out long-term trends. Through a series of step-by-step examples and simple strategies, readers will learn how to code it, define entry and exit signals, and conduct backtesting. Finally, the article presents practical optimization methods to enhance performance and adapt the system to changing market conditions.
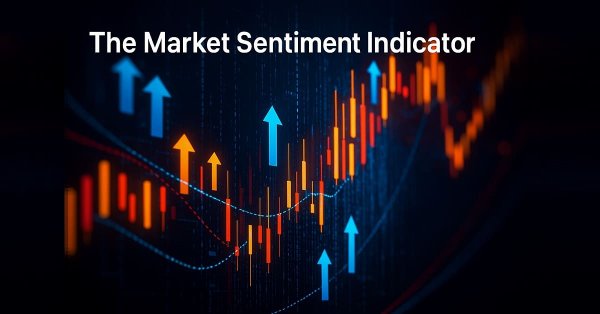
In this article, we automate a custom market sentiment indicator that classifies market conditions into bullish, bearish, risk-on, risk-off, and neutral. The Expert Advisor delivers real-time insights into prevailing sentiment while streamlining the analysis process for current market trends or direction.
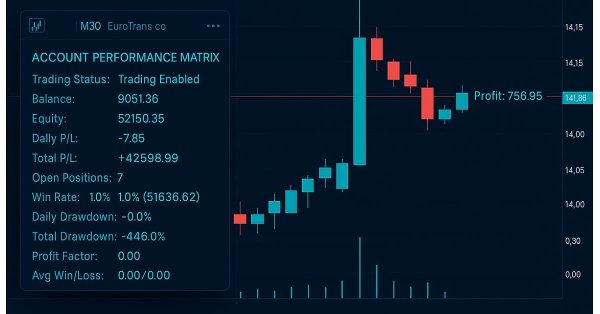
This indicator acts as a discipline enforcer by tracking account equity, profit/loss, and drawdown in real-time while displaying a performance dashboard. It can help traders stay consistent, avoid overtrading, and comply with prop-firm challenge rules.
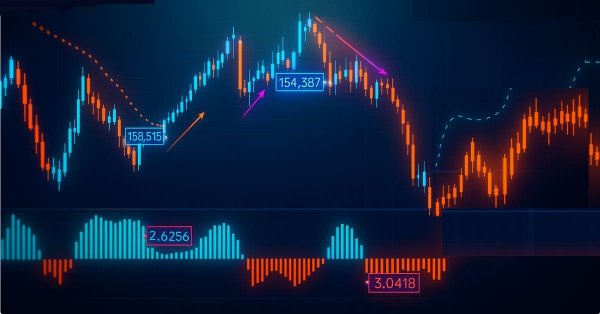
The Parafrac V2 Oscillator is an advanced technical analysis tool that integrates the Parabolic SAR with the Average True Range (ATR) to overcome limitations of its predecessor, which relied on fractals and was prone to signal spikes overshadowing previous and current signals. By leveraging ATR’s volatility measure, the version 2 offers a smoother, more reliable method for detecting trends, reversals, and divergences, helping traders reduce chart congestion and analysis paralysis.
This article explores the unique identity of each currency pair through the lens of its historical price action. Inspired by the concept of genetic DNA, which encodes the distinct blueprint of every living being, we apply a similar framework to the markets, treating price action as the “DNA” of each pair. By breaking down structural behaviors such as volatility, swings, retracements, spikes, and session characteristics, the tool reveals the underlying profile that distinguishes one pair from another. This approach provides more profound insight into market behavior and equips traders with a structured way to align strategies with the natural tendencies of each instrument.
In this article we are developing a custom market sentiment indicator to classify conditions into bullish, bearish, risk-on, risk-off, or neutral. Using multi-timeframe, the indicator can provide traders with a clearer perspective of overall market bias and short-term confirmations.
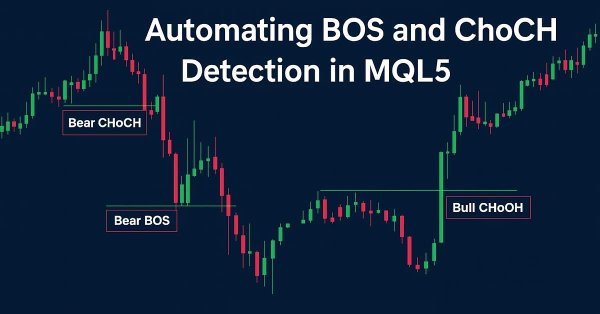
This article presents Fractal Reaction System, a compact MQL5 system that converts fractal pivots into actionable market-structure signals. Using closed-bar logic to avoid repainting, the EA detects Change-of-Character (ChoCH) warnings and confirms Breaks-of-Structure (BOS), draws persistent chart objects, and logs/alerts every confirmed event (desktop, mobile and sound). Read on for the algorithm design, implementation notes, testing results and the full EA code so you can compile, test and deploy the detector yourself.
This article is the first installment in a two-part series designed to impart practical skills and best practices for writing custom indicators in MQL5. Using Heikin Ashi as a working example, the article explores the theory behind Heikin Ashi charts, explains how Heikin Ashi candlesticks are calculated, and demonstrates their application in technical analysis. The centerpiece is a step-by-step guide to developing a fully functional Heikin Ashi indicator from scratch, with clear explanations to help readers understand what to code and why. This foundational knowledge sets the stage for Part Two, where we will build an expert advisor that trades based on Heikin Ashi logic.
Chart Synchronization for Easier Technical Analysis is a tool that ensures all chart timeframes display consistent graphical objects like trendlines, rectangles, or indicators across different timeframes for a single symbol. Actions such as panning, zooming, or symbol changes are mirrored across all synced charts, allowing traders to seamlessly view and compare the same price action context in multiple timeframes.
Trends are an important part of many trading strategies. In this article, we will look at some of the tools used to identify trends and their characteristics. Understanding and correctly interpreting trends can significantly improve trading efficiency and minimize risks.
This article presents an innovative approach to technical analysis based on converting price movements into binary code. The author demonstrates how various aspects of market behavior — from simple price movements to complex patterns — can be encoded in a sequence of zeros and ones.
Market sentiment is one of the most overlooked yet powerful forces influencing price movement. While most traders rely on lagging indicators or guesswork, the Sentiment Tilt Meter (STM) EA transforms raw market data into clear, visual guidance, showing whether the market is leaning bullish, bearish, or staying neutral in real-time. This makes it easier to confirm trades, avoid false entries, and time market participation more effectively.
We will explore how the Parabolic SAR and the Fractal indicator can be combined to create a new oscillator-based indicator. By integrating the unique strengths of both tools, traders can aim at developing a more refined and effective trading strategy.
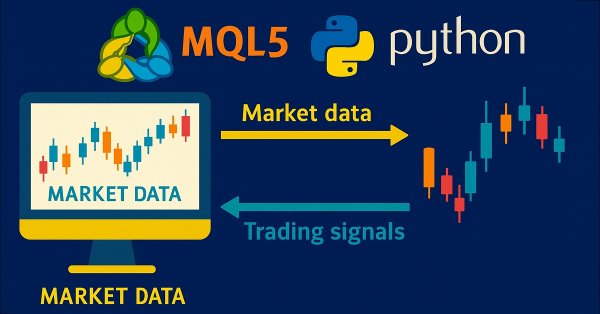
Harness the full potential of your MetaTrader 5 terminal by leveraging Python’s data-science ecosystem and the official MetaTrader 5 client library. This article demonstrates how to authenticate and stream live tick and minute-bar data directly into Parquet storage, apply sophisticated feature engineering with Ta and Prophet, and train a time-aware Gradient Boosting model. We then deploy a lightweight Flask service to serve trade signals in real time. Whether you’re building a hybrid quant framework or enhancing your EA with machine learning, you’ll walk away with a robust, end-to-end pipeline for data-driven algorithmic trading.
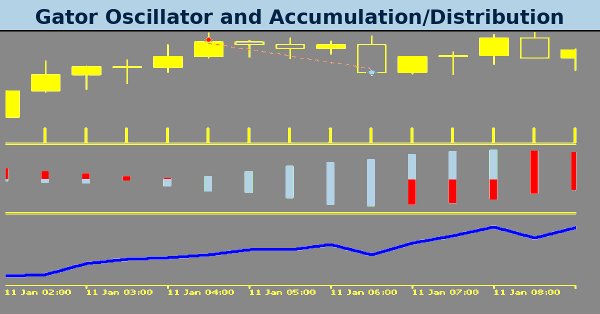
The article presents the second half of a structured approach to trading with the Gator Oscillator and Accumulation/Distribution. By introducing five new patterns, the author shows how to filter false moves, detect early reversals, and align signals across timeframes. With clear coding examples and performance tests, the material bridges theory and practice for MQL5 developers.
The Gator Oscillator by Bill Williams and the Accumulation/Distribution Oscillator are another indicator pairing that could be used harmoniously within an MQL5 Expert Advisor. We use the Gator Oscillator for its ability to affirm trends, while the A/D is used to provide confirmation of the trends via checks on volume. In exploring this indicator pairing, as always, we use the MQL5 wizard to build and test out their potential.
We follow up on our last article, where we introduced the indicator couple of the Awesome-Oscillator and the Envelope Channel, by looking at how this pairing could be enhanced with Supervised Learning. The Awesome-Oscillator and Envelope-Channel are a trend-spotting and support/resistance complimentary mix. Our supervised learning approach is a CNN that engages the Dot Product Kernel with Cross-Time-Attention to size its kernels and channels. As per usual, this is done in a custom signal class file that works with the MQL5 wizard to assemble an Expert Advisor.
The Awesome Oscillator by Bill Williams and the Envelopes Channel are a pairing that could be used complimentarily within an MQL5 Expert Advisor. We use the Awesome Oscillator for its ability to spot trends, while the envelopes channel is incorporated to define our support/resistance levels. In exploring this indicator pairing, we use the MQL5 wizard to build and test any potential these two may possess.
The Ichimoku-Kinko-Hyo Indicator and the ADX-Wilder oscillator are a pairing that could be used in complimentarily within an MQL5 Expert Advisor. The Ichimoku is multi-faceted, however for this article, we are relying on it primarily for its ability to define support and resistance levels. Meanwhile, we also use the ADX to define our trend. As usual, we use the MQL5 wizard to build and test any potential these two may possess.
In this article, we will learn how to create an indicator that detects, draws, and alerts on the mitigation of order blocks. We will also take a detailed look at how to identify these blocks on the chart, set accurate alerts, and visualize their position using rectangles to better understand the price action. This indicator will serve as a key tool for traders who follow the Smart Money Concepts and the Inner Circle Trader methodology.