It is time to animate the graphical interface by implementing the functionality for object interaction with users and objects. The new functionality will also be necessary to let more complex objects work correctly.
Matrices and vectors have been introduced in MQL5 for efficient operations with mathematical solutions. The new types offer built-in methods for creating concise and understandable code that is close to mathematical notation. Arrays provide extensive capabilities, but there are many cases in which matrices are much more efficient.
The article considers creation of 'GroupBox' and 'CheckBox' WinForms objects, as well as the development of base objects for WinForms object categories. All created objects are still static, i.e. they are unable to interact with the mouse.
This article provides a method to create complex indicators while also avoiding the problems that arise when dealing with multiple plots, buffers and/or combining data from multiple sources.
In this article we continue considering how to obtain data from the web and to use it in an Expert Advisor. This time we will proceed to developing an alternative system.
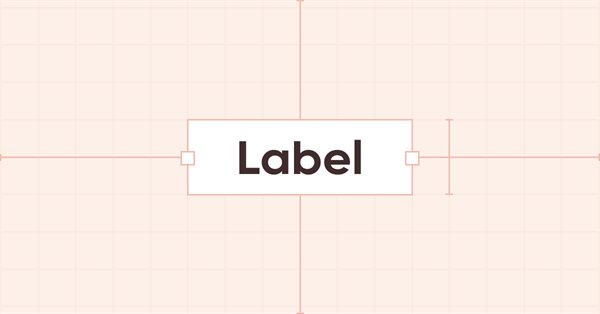
In the current article, I will create the class of the WinForms text label control object. Such an object will have the ability to position its container anywhere, while its own functionality will repeat the functionality of the MS Visual Studio text label. We will be able to set font parameters for a displayed text.
In the article, I will continue my work on the Panel WinForms object and implement its auto resizing to fit the general size of Dock objects located inside the panel. Besides, I will add the new properties to the Symbol library object.
It has been more than a year since I published my last article. This is quite a lot time to revise ideas and to develop new approaches. In the new article, I would like to divert from the previously used supervised learning method. This time we will dip into unsupervised learning algorithms. In particular, we will consider one of the clustering algorithms—k-means.
In the article, I will create the base object of all library WinForms objects and start implementing the AutoSize property of the Panel WinForms object — auto sizing for fitting the object internal content.
In this article, I will implement handling Padding (internal indents/margin on all sides of an element) and Dock parameters (the way an object is located inside its container).
Check out this selection of useful materials which can assist traders in improving their algorithmic trading knowledge. The era of simple algorithms is passing, and it is becoming harder to succeed without the use of Machine Learning techniques and Neural Networks.
In this article, I will create subordinate controls bound to the base element. The development will be performed using the base control functionality. In addition, I will tinker with the graphical element shadow object a bit since it still suffers from some logic errors when applied to any of the objects capable of having a shadow.
In the current article, I will get rid of some errors related to handling graphical elements and continue the development of the CPanel control. In particular, I will implement the methods for setting the parameters of the font used by default for all panel text objects.
This article starts an extensive topic of creating controls in Windows Forms style using MQL5. My first object of interest is creating the panel class. It is already becoming difficult to manage things without controls. Therefore, I will create all possible controls in Windows Forms style.
In the current article, I will eliminate obvious flaws in simultaneous handling of extended (and standard) graphical objects and form objects on canvas, as well as fix errors detected during the test performed in the previous article. The article concludes this section of the library description.
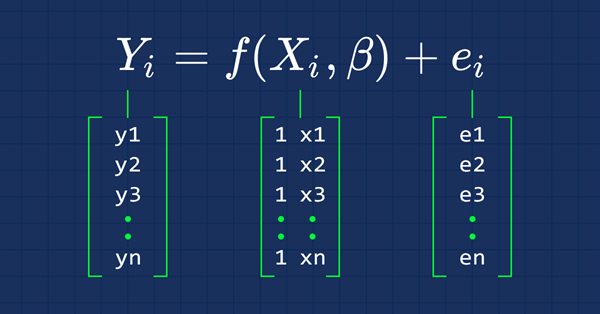
This time our models are being made by matrices, which allows flexibility while it allows us to make powerful models that can handle not only five independent variables but also many variables as long as we stay within the calculations limits of a computer, this article is going to be an interesting read, that's for sure.
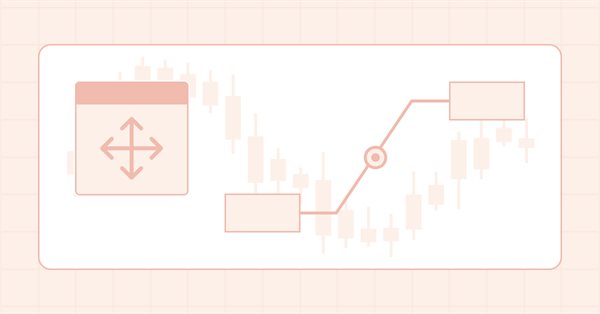
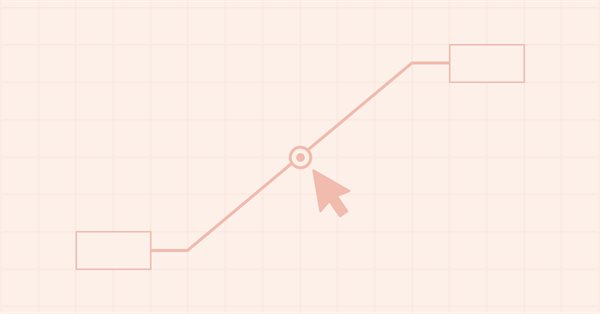
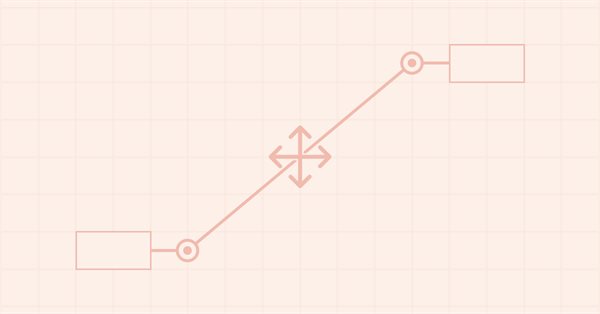
In the previous article, I implemented the ability to move pivot points of an extended graphical object using control forms. Now I am going to implement the ability to move a composite graphical object using a single graphical object control point (form).
In the article, I continue the development of extended standard graphical objects and create the functionality for moving pivot points of composite graphical objects using the control points for managing the coordinates of the graphical object pivot points.
Today we will update the functionality of the indicator system for the first time. In the previous article within the "Multiple indicators on one chart" we considered the basic code which allows using more than one indicator in a chart subwindow. But what was presented was just the starting base of a much larger system.
In the previous article "Multiple indicators on one chart" I presented the concept and the basics of how to use multiple indicators on one chart. In this article, I will provide the source code and will explain it in detail.
The article considers several methods of applying the Moving Average indicator. Each method involving a curve analysis is accompanied by indicators visualizing the idea. In most cases, the ideas shown here belong to their respected authors. My sole task was to bring them together to let you see the main approaches and, hopefully, make more reasonable trading decisions. MQL5 proficiency level — basic.
Many workstations contain some representative image which shows something about the user. These images make the working environment more beautiful and exciting. Let's see how to make the charts more interesting by adding a background.
In this article, I will consider the implementation of the independent dragging of any form objects using a mouse. Besides, I will complement the library by error messages and new deal properties previously implemented into the terminal and MQL5.
The article considers the use of the CCanvas class in MQL applications. The theory is accompanied by detailed explanations and examples for thorough understanding of CCanvas basics.
Today we will learn how to add multiple indicators running simultaneously on one chart, but without occupying a separate area on it. Many traders feel more confident if they monitor multiple indicators at a time (for example, RSI, STOCASTIC, MACD, ADX and some others), or in some cases even at different assets which an index is made of.
In this article, I will start creating the functionality for handling mouse events in form objects, as well as add new properties and their tracking to a symbol object. Besides, I will improve the symbol object class since the chart symbols now have new properties to be considered and tracked.
In this article, I will consider the toolkit for managing composite graphical objects - controls for managing an extended standard graphical object. Today, I will slightly digress from relocating a composite graphical object and implement the handler of change events on a chart featuring a composite graphical object. Besides, I will focus on the controls for managing a composite graphical object.
In this article, I will start the development of various composite graphical object events. We will also partially consider moving and deleting a composite graphical object. In fact, here I am going to fine-tune the things I implemented in the previous article.
In this article, I will start developing the functionality for creating composite graphical objects. The library will support creating composite graphical objects allowing those objects have any hierarchy of connections. I will prepare all the necessary classes for subsequent implementation of such objects.
In the article, I will create the class of the standard graphical object memory allowing the object to save its states when its properties are modified. In turn, this allows retracting to the previous graphical object states.
In this article, I will refine the basic functionality for providing control over graphical object events from a library-based program. I will start from implementing the functionality for storing the graphical object change history using the "Object name" property as an example.
In this article, I will implement the basic functionality for tracking standard graphical object events. I will start from a double click event on a graphical object.
Currently, the library is able to track standard graphical objects on the client terminal chart, including their removal and modification of some of their parameters. At the moment, it lacks the ability to create standard graphical objects from custom programs.
In this article, we will use the WinHttp.dll to create a WebSocket client for MetaTrader 5 programs. The client will ultimately be implemented as a class and also tested against the Deriv.com WebSocket API.
In this article, we will further develop the idea of drawing graphical objects on charts using keyboard shortcuts. New tools have been added to the library, including a straight line plotted through arbitrary vertices, and a set of rectangles that enable the evaluation of the reversal time and level. Also, the article shows the possibility to optimize code for improved performance. The implementation example has been rewritten, allowing the use of Shortcuts alongside other trading programs. Required code knowledge level: slightly higher than a beginner.