The article enhances an MQL5 footprint indicator with a compact box above each candle that summarizes net delta, total volume, and buy/sell percentages. We implement supersampled anti‑aliased rendering, rounded corners via arc and quadrilateral rasterization, and per‑pixel alpha compositing. Supporting utilities include ARGB conversion, scanline fills, and box‑filter downsampling. The box delivers fast sentiment reads that stay legible across zoom levels.
This article explores the development of a Market Entropy Indicator based on principles from Information Theory to measure the uncertainty and information content within financial markets. By applying concepts such as Shannon Entropy to price movements, the indicator quantifies whether the market is structured (trending), transitioning, or chaotic.
This article builds an order-flow footprint indicator in MQL5 that aggregates tick-by-tick volume into quantized price levels and supports Bid vs Ask and Delta display modes. A canvas overlay renders color-scaled volume text aligned with the candles and updates on every tick. You will learn sorting of price levels, max-value normalization for color mapping, and responsive redraws on zoom, scroll, and resize to read volume distribution and aggressor dominance inside each bar.
This article presents an MQL5 indicator that detects and manages liquidity zone flips. It identifies supply and demand zones from higher timeframes using a base–impulse pattern, applies objective breakout and impulse thresholds, and flips zones automatically when structure changes. The result is a dynamic support‑resistance map that reduces manual redraws and gives you clear, actionable context for signals and retests.
The alignment of higher-timeframe liquidity structures with lower-timeframe reversal patterns can greatly influence both the likelihood and direction of the next price movement. By integrating structural liquidity zones from higher timeframes with precise reversal confirmations on lower timeframes, traders can improve entry timing and overall trade quality. This article demonstrates how to reinforce liquidity-based trading strategies through higher-timeframe structural confirmation—and how to implement this approach effectively using MQL5.
This article develops a practical MQL5 indicator that identifies Hidden Smash Day bars by strict numeric criteria and optional confirmation on the following session. We cover detection routines, buffer registration, and plot configuration to place arrows at valid bars. The approach delivers stable, non-repainting signals for historical testing and real-time monitoring.
This article details an MQL5 framework that restricts trading to an approved set of symbols. The solution combines a shared library, a configuration dashboard, and an enforcement Expert Advisor that validates each trade against a whitelist and logs blocked attempts. It includes fully functional code examples, a clear explanation of the structural design decisions, and validation tests that confirm reliable symbol filtering, controlled market exposure, and transparent monitoring of rule enforcement.
In this part of the Price Action Analysis Toolkit Development series, we develop an MQL5 indicator that automatically detects rising and falling wedge patterns in real time. The system confirms pivot structures, validates boundary convergence mathematically, prevents overlapping formations, and monitors breakout and failure conditions with precise visual feedback. Built using a clean object-oriented architecture, this implementation converts subjective wedge recognition into a structured, state-aware analytical component designed to strengthen disciplined price action analysis.
In this article, we enhance the hybrid Time Price Opportunity (TPO) market profile indicator in MQL5 by integrating volume data to calculate volume-based point of control, value areas, and volume-weighted average price with customizable highlighting options. The system introduces advanced features like initial balance detection, key level extension lines, split profiles, and alternative TPO characters such as squares or circles for improved visual analysis across multiple timeframes.
In this article, we develop a custom indicator in MQL5 for hybrid Time Price Opportunity (TPO) market profiles, supporting multiple session timeframes such as intraday, daily, weekly, monthly, and fixed periods with timezone adjustments. The indicator quantizes prices into a grid, tracks session data including highs, lows, opens, and closes, and calculates key elements like the point of control and value area based on TPO counts. It renders profiles visually on the chart with customizable colors for TPO letters, single prints, value areas, POC, and close markers, enabling detailed session analysis
Many programmers might assume we should abandon using Excel and move directly to Python, using some packages that allow Python to generate an Excel file for later analysis of results. However, as mentioned in the previous article, although this solution is the simplest for many programmers, it will not be accepted by some users. And in this particular case, the user is always right. As programmers, we must find a way to make everything work.
We convert Larry Williams’ Smash Day reversal rules into a practical MQL5 indicator that flags confirmed setups with arrows. Step by step, the text shows buffer binding, plot properties, historical mapping, and real‑time updates inside OnCalculate. Adjustable lookback parameters and clean chart rendering help you detect valid reversals quickly while keeping final trade decisions discretionary and context‑driven.
Building on the previous article that introduced the market state classification module, this installment focuses on implementing the core logic for identifying and evaluating compression zones. It presents a range contraction detection and maturity grading system in MQL5 that analyzes market congestion using price action alone.
Wave analysis is one of the methods used in technical analysis. This article focuses on two less conventional wave patterns: triangular and sawtooth waves. These formations underpin a number of technical indicators designed for market price analysis.
In this article, we build a versatile RSI indicator in MQL5 supporting multiple variants, data sources, and smoothing methods for improved analysis. We add hue shifts for color visuals, dynamic boundaries for overbought/oversold zones, and notifications for trend alerts. It includes multi-timeframe support with interpolation, offering us a customizable RSI tool for diverse strategies.
In this discussion, we will develop an indicator to identify price zones created by strong market activity, such as impulsive moves, structure shifts, and liquidity events. These zones represent areas where the market has left “memory” due to unfilled orders or rapid price displacement. By marking these regions on the chart, the indicator highlights where price is statistically more likely to revisit and react in the future.
In this article, we enhance the Smart WaveTrend Crossover indicator in MQL5 by integrating canvas-based drawing for fog gradient overlays, signal boxes that detect breakouts, and customizable buy/sell bubbles or triangles for visual alerts. We incorporate risk management features with dynamic take-profit and stop-loss levels calculated via candle multipliers or percentages, displayed through lines and a table, alongside options for trend filtering and box extensions.
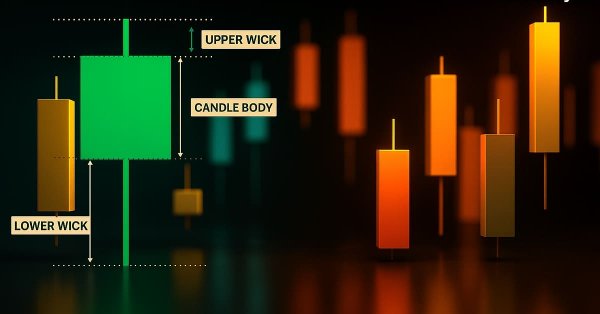
This article presents the design and MetaTrader 5 implementation of the Candle Pressure Index (CPI)—a CLV-based overlay that visualizes intra-Bar buying and selling pressure directly on price charts. The discussion focuses on candle structure, pressure classification, visualization mechanics, and a non-repainting, transition-based alert system designed for consistent behavior across timeframes and instruments.
This article explores a method that combines Heikin‑Ashi smoothing with EMA20 High and Low boundaries and an EMA50 trend filter to improve trade clarity and timing. It demonstrates how these tools can help traders identify genuine momentum, filter out noise, and better navigate volatile or trending markets.
This article demonstrates how to automate Larry Williams’ volatility breakout strategy in MQL5 using a practical, step-by-step approach. You will learn how to calculate daily range expansions, derive buy and sell levels, manage risk with range-based stops and reward-based targets, and structure a professional Expert Advisor for MetaTrader 5. Designed for traders and developers looking to transform Larry Williams’ market concepts into a fully testable and deployable automated trading system.
In this article, we develop a custom indicator in MQL5 called Smart WaveTrend Crossover, utilizing dual WaveTrend oscillators—one for generating crossover signals and another for trend filtering—with customizable parameters for channel, average, and moving average lengths. The indicator plots colored candles based on the trend direction, displays buy and sell arrow signals on crossovers, and includes options to enable trend confirmation and adjust visual elements like colors and offsets.
Build a practical MetaTrader 5 “Sigma Score” indicator from scratch and learn what it really measures: The z-score of log returns (how many standard deviations the latest move is from the recent average). The article walks through every code block in OnInit(), OnCalculate(), and OnDeinit(), then shows how to interpret thresholds (e.g., ±2) and apply the Sigma Score as a simple “market stress meter” for mean-reversion and momentum trading.
In this article, we enhance the gauge-based indicator in MQL5 to support multiple oscillators, allowing user selection through an enumeration for single or combined displays. We introduce sector and round gauge styles via derived classes from a base gauge framework, improving case rendering with arcs, lines, and polygons for a more refined visual appearance.
Market rules are continuously evolving, and many once-reliable principles gradually lose their effectiveness. What worked in the past no longer works consistently over time. Today’s discussion focuses on probability ranges and how they can be used to navigate market irregularities. We will leverage MQL5 to develop an algorithm capable of trading effectively even in the choppiest market conditions. Join this discussion to find out more.
In this article, we develop a gauge-style RSI indicator in MQL5 that visualizes Relative Strength Index values on a circular scale with a dynamic needle, color-coded ranges for overbought and oversold levels, and customizable legends. We utilize the Canvas class to draw elements like arcs, ticks, and pies, ensuring smooth updates on new RSI data.
A practical guide to building a Larry Williams–style market structure indicator in MQL5, covering buffer setup, swing-point detection, plot configuration, and how traders can apply the indicator in technical market analysis.
In this article, we create a Pivot-Based Trend Indicator in MQL5 that calculates fast and slow pivot lines over user-defined periods, detects trend directions based on price relative to these lines, and signals trend starts with arrows while optionally extending lines beyond the current bar. The indicator supports dynamic visualization with separate up/down lines in customizable colors, dotted fast lines that change color on trend shifts, and optional gradient filling between lines, using a canvas object for enhanced trend-area highlighting.
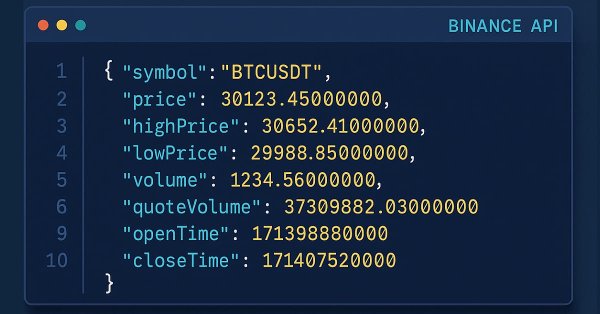
This article will show you how to visualize candle data obtained via the WebRequest function and API in candle format. We'll use MQL5 to read the candle data from a CSV file and display it as custom candles on the chart, since indicators cannot directly use the WebRequest function.
We continue our look at how the selection of indicators can be pipelined when facing a ‘none-typical’ MetaTrader asset. MetaTrader 5 is primarily used to trade forex, and that is good given the liquidity on offer, however the case for trading outside of this ‘comfort-zone’, is growing bolder with not just the overnight rise of platforms like Robinhood, but also the relentless pursuit of an edge for most traders. We consider the XLF ETF for this article and also cap our revamped pipeline with a simple MLP.
Learn how to use WebRequest and external API calls to retrieve recent candle data, convert each value into a usable type, and save the information neatly in a table format. This step lays the groundwork for building an indicator that visualizes the data in candle format.
We continue our look at how MetaTrader can be used outside its forex trading ‘comfort-zone’ by looking at another tradable asset in the form of the FXI ETF. Unlike in the last article where we tried to do ‘too-much’ by delving into not just indicator selection, but also considering indicator pattern combinations, for this article we will swim slightly upstream by focusing more on indicator selection. Our end product for this is intended as a form of pipeline that can help recommend indicators for various assets, provided we have a reasonable amount of their price history.
In the world of technical analysis, price often takes center stage. Traders meticulously map out support, resistance, and patterns, yet frequently ignore the critical force that drives these movements: volume. This article delves into a novel approach to volume analysis: the Volume Boundary indicator. This transformation, utilizing sophisticated smoothing functions like the butterfly and triple sine curves, allows for clearer interpretation and the development of systematic trading strategies.
This article introduces the Pattern Density Heatmap, a price‑action mapping tool that transforms repeated candlestick pattern detections into statistically significant support and resistance zones. Rather than treating each signal in isolation, the EA aggregates detections into fixed price bins, scores their density with optional recency weighting, and confirms levels against higher‑timeframe data. The resulting heatmap reveals where the market has historically reacted—levels that can be used proactively for trade timing, risk management, and strategy confidence across any trading style.
In this article, we look to explore how a complimentary indicator pairing can be used to analyze the recent 5-year history of Vanguard Information Technology Index Fund ETF. By considering two options of algorithms, Kendall’s Tau and Distance-Correlation, we look to select not just an ideal indicator pair for trading the VGT, but also suitable signal-pattern pairings of these two indicators.
This article presents the Multi‑Timeframe Visual Analyzer, an MQL5 Expert Advisor that reconstructs and overlays higher‑timeframe candles directly onto your active chart. It explains the implementation, key inputs, and practical outcomes, supported by an animated demo and chart examples showing instant toggling, multi‑timeframe confirmation, and configurable alerts. Read on to see how this tool can make chart analysis faster, clearer, and more efficient.
Learn how to build a complete Kagi Chart engine in MQL5—constructing price reversals, generating dynamic line segments, and updating Kagi structures in real time. This first part teaches you how to render Kagi charts directly on MetaTrader 5, giving traders a clear view of trend shifts and market strength while preparing for automated Kagi-based trading logic in Part 2.
The relentless quest to decode market rhythms has led traders and quantitative analysts to develop countless mathematical models. This article has introduced the Flower Volatility Index (FVI), a novel approach that transforms the mathematical elegance of Rose Curves into a functional trading tool. Through this work, we have shown how mathematical models can be adapted into practical trading mechanisms capable of supporting both analysis and decision-making in real market conditions.
This article is intended for algorithmic traders, quantitative analysts, and MQL5 developers interested in enhancing their understanding of candlestick pattern recognition through practical implementation. It provides an in‑depth exploration of the CandlePatternSearch.mq5 Expert Advisor—a complete framework for detecting, visualizing, and monitoring classical candlestick formations in MetaTrader 5. Beyond a line‑by‑line review of the code, the article discusses architectural design, pattern detection logic, GUI integration, and alert mechanisms, illustrating how traditional price‑action analysis can be automated efficiently.
We continue our new series on Market-Positioning, where we study particular assets, with specific trade directions over manageable test windows. We started this by considering Nvidia Corp stock in the last article, where we covered 5 signal patterns from the complimentary pairing of the RSI and DeMarker oscillators. For this article, we cover the remaining 5 patterns and also delve into multi-pattern options that not only feature untethered combinations of all ten, but also specialized combinations of just a pair.
Generating new indicators from existing ones offers a powerful way to enhance trading analysis. By defining a mathematical function that integrates the outputs of existing indicators, traders can create hybrid indicators that consolidate multiple signals into a single, efficient tool. This article introduces a new indicator built from three oscillators using a modified version of the Pearson correlation function, which we call the Pseudo Pearson Correlation (PPC). The PPC indicator aims to quantify the dynamic relationship between oscillators and apply it within a practical trading strategy.