At the start of each trading session, the market’s directional bias often becomes clear only after price moves beyond the opening range. In this article, we explore how to build an MQL5 Expert Advisor that automatically detects and analyzes Opening Range Breakouts, providing you with timely, data‑driven signals for confident intraday entries.
The Moving-Average-Convergence-Divergence (MACD) oscillator and the On-Balance-Volume (OBV) oscillator are another pair of indicators that could be used in conjunction within an MQL5 Expert Advisor. This pairing, as is practice in these article series, is complementary with the MACD affirming trends while OBV checks volume. As usual, we use the MQL5 wizard to build and test any potential these two may possess.
We follow up our last article, where we introduced the indicator pair of the SAR and the RVI, by considering how this indicator pairing could be extended with Machine Learning. SAR and RVI are a trend and momentum complimentary pairing. Our machine learning approach uses a convolution neural network that engages the Exponential kernel in sizing its kernels and channels, when fine-tuning the forecasts of this indicator pairing. As always, this is done in a custom signal class file that works with the MQL5 wizard to assemble an Expert Advisor.
The Parabolic-SAR (SAR) and the Relative Vigour Index (RVI) are another pair of indicators that could be used in conjunction within an MQL5 Expert Advisor. This indicator pair, like those we’ve covered in the past, is also complementary since SAR defines the trend while RVI checks momentum. As usual, we use the MQL5 wizard to build and test any potential this indicator pairing may have.
Aligned with our goal of developing practical price-action tools, this article explores the creation of an EA that detects pin bar and engulfing patterns, using RSI divergence as a confirmation trigger before generating any trading signals.
We follow up our last article, where we introduced the indicator pair of TRIX and Williams Percent Range, by considering how this indicator pairing could be extended with Machine Learning. TRIX and William’s Percent are a trend and support/ resistance complimentary pairing. Our machine learning approach uses a convolution neural network that engages the cosine kernel in its architecture when fine-tuning the forecasts of this indicator pairing. As always, this is done in a custom signal class file that works with the MQL5 wizard to assemble an Expert Advisor.
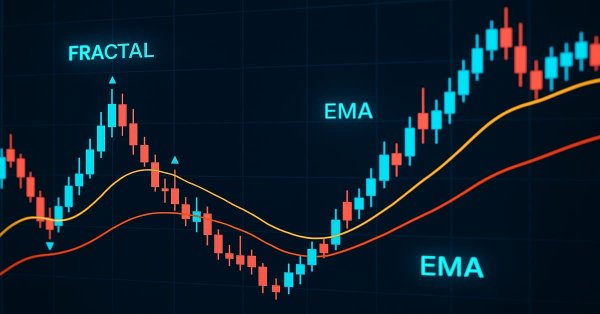
Price action is a fundamental approach for identifying profitable trading setups. However, manually monitoring price movements and patterns can be challenging and time-consuming. To address this, we are developing tools that analyze price action automatically, providing timely signals whenever potential opportunities are detected. This article introduces a robust tool that leverages fractal breakouts alongside EMA 14 and EMA 200 to generate reliable trading signals, helping traders make informed decisions with greater confidence.
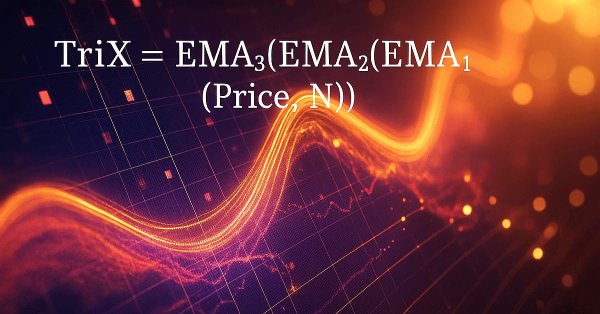
The Triple Exponential Moving Average Oscillator (TRIX) and the Williams Percentage Range Oscillator are another pair of indicators that could be used in conjunction within an MQL5 Expert Advisor. This indicator pair, like those we’ve covered recently, is also complementary given that TRIX defines the trend while Williams Percent Range affirms support and Resistance levels. As always, we use the MQL5 wizard to prototype any potential these two may have.
This article introduces beginners to building an MQL5 Expert Advisor that identifies and trades a classic technical chart pattern — the Head and Shoulders. It covers how to detect the pattern using price action, draw it on the chart, set entry, stop loss, and take profit levels, and automate trade execution based on the pattern.
The Fractal Adaptive Moving Average (FrAMA) and the Force Index Oscillator are another pair of indicators that could be used in conjunction within an MQL5 Expert Advisor. These two indicators complement each other a little bit because FrAMA is a trend following indicator while the Force Index is a volume based oscillator. As always, we use the MQL5 wizard to rapidly explore any potential these two may have.
Do you know what really drives a currency pair’s direction? It’s the strength of each individual currency. In this article, we’ll measure a currency’s strength by looping through every pair it appears in. That insight lets us predict how those pairs may move based on their relative strengths. Read on to learn more.
This tool is a Correlation Dashboard that calculates and displays real-time correlation coefficients across multiple currency pairs. By visualizing how pairs move in relation to one another, it adds valuable context to your price-action analysis and helps you anticipate inter-market dynamics. Read on to explore its features and applications.
Enhance your MQL5 code by optimizing logic, refining calculations, and reducing execution time to improve back-test accuracy. Fine-tune parameters, optimize loops, and eliminate inefficiencies for better performance.
The DeMarker Oscillator and the Envelopes' indicator are momentum and support/ resistance tools that can be paired when developing an Expert Advisor. We continue from our last article that introduced these pair of indicators by adding machine learning to the mix. We are using a recurrent neural network that uses the white-noise kernel to process vectorized signals from these two indicators. This is done in a custom signal class file that works with the MQL5 wizard to assemble an Expert Advisor.
The DeMarker Oscillator and the Envelope indicator are momentum and support/resistance tools that can be paired when developing an Expert Advisor. We therefore examine on a pattern by pattern basis what could be of use and what potentially avoid. We are using, as always, a wizard assembled Expert Advisor together with the Patterns-Usage functions that are built into the Expert Signal Class.
This article details creating an MQL5 Market Regime Detection System using statistical methods like autocorrelation and volatility. It provides code for classes to classify trending, ranging, and volatile conditions and a custom indicator.
Portfolio Diversification and Optimization strategically spreads investments across multiple assets to minimize risk while selecting the ideal asset mix to maximize returns based on risk-adjusted performance metrics.
In this article, you'll learn how to build a price action indicator in MQL5, focusing on key points like low (L), high (H), higher low (HL), higher high (HH), lower low (LL), and lower high (LH) for analyzing trends. You'll also explore how to identify the premium and discount zones, mark the 50% retracement level, and use the risk-reward ratio to calculate profit targets. The article also covers determining entry points, stop loss (SL), and take profit (TP) levels based on the trend structure.
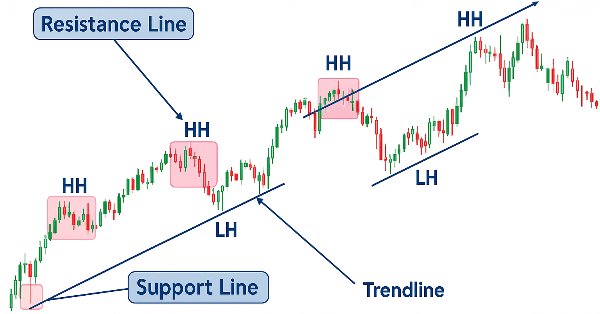
Every price action trader manually uses trendlines to confirm trends and spot potential turning or continuation levels. In this series on developing a price action analysis toolkit, we introduce a tool focused on drawing slanted trendlines for easy market analysis. This tool simplifies the process for traders by clearly outlining key trends and levels essential for effective price action evaluation.
In this article, I will describe how to make a simple panel to change the indicator settings directly from the chart, and what changes need to be made to the indicator to connect the panel. This article is intended for novice MQL5 users.
Moving Average and Stochastic Oscillator are very common indicators whose collective patterns we explored in the prior article, via a supervised learning network, to see which “patterns-would-stick”. We take our analyses from that article, a step further by considering the effects' reinforcement learning, when used with this trained network, would have on performance. Readers should note our testing is over a very limited time window. Nonetheless, we continue to harness the minimal coding requirements afforded by the MQL5 wizard in showcasing this.
Learn to build a Harmonic Pattern indicator in MQL5 using chart objects. Discover how to detect swing points, apply Fibonacci retracements, and automate pattern recognition.
In this article, we will share insights on how to leverage MQL5 programming to pinpoint market levels—differentiating between weaker and strongest price levels. We will fully develop a working, Support and Resistance Strength Indicator (SRSI).
Moving Average and Stochastic Oscillator are very common indicators that some traders may not use a lot because of their lagging nature. In a 3-part ‘miniseries' that considers the 3 main forms of machine learning, we look to see if this bias against these indicators is justified, or they might be holding an edge. We do our examination in wizard assembled Expert Advisors.
In a world overflowing with noisy and unpredictable data, identifying meaningful patterns can be challenging. In this article, we'll explore seasonal decomposition, a powerful analytical technique that helps separate data into its key components: trend, seasonal patterns, and noise. By breaking data down this way, we can uncover hidden insights and work with cleaner, more interpretable information.
In our previous article, we introduced a simple script called "The Quarters Drawer." Building on that foundation, we are now taking the next step by creating a monitor Expert Advisor (EA) to track these quarters and provide oversight regarding potential market reactions at these levels. Join us as we explore the process of developing a zone detection tool in this article.
The Fractals by Bill Williams is a potent indicator that is easy to overlook when one initially spots it on a price chart. It appears too busy and probably not incisive enough. We aim to draw away this curtain on this indicator by examining what its various patterns could accomplish when examined with forward walk tests on all, with wizard assembled Expert Advisor.
Embracing technical indicators in price action analysis is a powerful approach. These indicators often highlight key levels of reversals and retracements, offering valuable insights into market dynamics. In this article, we demonstrate how we developed an automated tool that generates signals using the Parabolic SAR indicator.
Price action can be effectively analyzed by identifying divergences, with technical indicators such as the RSI providing crucial confirmation signals. In the article below, we explain how automated RSI divergence analysis can identify trend continuations and reversals, thereby offering valuable insights into market sentiment.
In this article, we build a Keltner Channel indicator with custom canvas graphics in MQL5. We detail the integration of moving averages, ATR calculations, and enhanced chart visualization. We also cover backtesting to evaluate the indicator’s performance for practical trading insights.
The flow of the market is determined by the forces between bulls and bears. There are specific levels that the market respects due to the forces acting on them. Fibonacci and VWAP levels are especially powerful in influencing market behavior. Join me in this article as we explore a strategy based on VWAP and Fibonacci levels for signal generation.
Learn how to build a custom indicator in MQL5. With a project-based approach. This beginner-friendly guide covers indicator buffers, properties, and trend visualization, allowing you to learn step-by-step.
We continue our dive into chaos theory in financial markets. This time I will consider its applicability to the analysis of currencies and other assets.
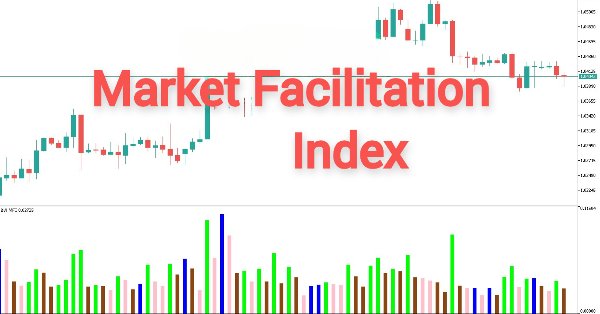
The Market Facilitation Index is another Bill Williams Indicator that is intended to measure the efficiency of price movement in tandem with volume. As always, we look at the various patterns of this indicator within the confines of a wizard assembly signal class, and present a variety of test reports and analyses for the various patterns.
An innovative approach to collecting indicator information in MQL5 enables more flexible and streamlined data analysis by allowing developers to pass custom inputs to indicators for immediate calculations. This approach is particularly useful for algorithmic trading, as it provides enhanced control over the information processed by indicators, moving beyond traditional constraints.
As one of the most powerful Price Action analysis toolkits, the Metrics Board is designed to streamline market analysis by instantly providing essential market metrics with just a click of a button. Each button serves a specific function, whether it’s analyzing high/low trends, volume, or other key indicators. This tool delivers accurate, real-time data when you need it most. Let’s dive deeper into its features in this article.
Discover how to develop an Expert Advisor (EA) in MQL5 using multiple indicators like RSI, MA, and Stochastic Oscillator to detect hidden bullish and bearish divergences. Learn to implement effective risk management and automate trades with detailed examples and fully commented source code for educational purposes!
The Accelerator Oscillator is another Bill Williams Indicator that tracks price momentum's acceleration and not just its pace. Although much like the Awesome oscillator we reviewed in a recent article, it seeks to avoid the lagging effects by focusing more on acceleration as opposed to just speed. We examine as always what patterns we can get from this and also what significance each could have in trading via a wizard assembled Expert Advisor.