Before we proceed to the second stage of development, we need to revise some ideas. Do you know how to make MQL5 do what you need? Have you ever tried to go beyond what is contained in the documentation? If not, then get ready. Because we will be doing something that most people don't normally do.
This article presents a unique experiment that aims to examine the behavior of population optimization algorithms in the context of their ability to efficiently escape local minima when population diversity is low and reach global maxima. Working in this direction will provide further insight into which specific algorithms can successfully continue their search using coordinates set by the user as a starting point, and what factors influence their success.
Moving Averages are a very common indicator that are used and understood by most Traders. We explore possible use cases that may not be so common within MQL5 Wizard assembled Expert Advisors.
The article represents a unique research attempt to combine a variety of population algorithms into a single class to simplify the application of optimization methods. This approach not only opens up opportunities for the development of new algorithms, including hybrid variants, but also creates a universal basic test stand. This stand becomes a key tool for choosing the optimal algorithm depending on a specific task.
In the forex markets It is very challenging to predict the future trend without having an idea of the past. Very few machine learning models are capable of making the future predictions by considering past values. In this article, we are going to discuss how we can use classical(Non-time series) Artificial Intelligence models to beat the market
In this article we demonstrate how Hidden Markov Models trained using Python can be integrated into MetaTrader 5 applications. Hidden Markov Models are a powerful statistical tool used for modeling time series data, where the system being modeled is characterized by unobservable (hidden) states. A fundamental premise of HMMs is that the probability of being in a given state at a particular time depends on the process's state at the previous time slot.
In this article, inheritance will be introduced into our previous and new code. A new database design will be implemented to provide efficiency. Additionally, a risk management class will be created to tackle volume calculations.
Economic Calendar Data is not available for testing with Expert Advisors within Strategy Tester, by default. We look at how Databases could help in providing a work around this limitation. So, for this article we explore how SQLite databases can be used to archive Economic Calendar news such that wizard assembled Expert Advisors can use this to generate trade signals.
These advanced gradient-boosted decision tree techniques offer superior performance and flexibility, making them ideal for financial modeling and algorithmic trading. Learn how to leverage these tools to optimize your trading strategies, improve predictive accuracy, and gain a competitive edge in the financial markets.
We will consider the principle of constructing multi-population algorithms. As an example of this type of algorithm, we will have a look at the new custom algorithm - Evolution of Social Groups (ESG). We will analyze the basic concepts, population interaction mechanisms and advantages of this algorithm, as well as examine its performance in optimization problems.
With the rapid development of artificial intelligence today, language models (LLMs) are an important part of artificial intelligence, so we should think about how to integrate powerful LLMs into our algorithmic trading. For most people, it is difficult to fine-tune these powerful models according to their needs, deploy them locally, and then apply them to algorithmic trading. This series of articles will take a step-by-step approach to achieve this goal.
In this fourth part, we revisit the Simple Hedge and Simple Grid Expert Advisors (EAs) developed earlier. Our focus shifts to refining the Simple Grid EA through mathematical analysis and a brute force approach, aiming for optimal strategy usage. This article delves deep into the mathematical optimization of the strategy, setting the stage for future exploration of coding-based optimization in later installments.
In this article, we will look at the theory of causal inference using machine learning, as well as the custom approach implementation in Python. Causal inference and causal thinking have their roots in philosophy and psychology and play an important role in our understanding of reality.
Spurious regressions occur when two time series exhibit a high degree of correlation purely by chance, leading to misleading results in regression analysis. In such cases, even though variables may appear to be related, the correlation is coincidental and the model may be unreliable.
Symbolic Regression is a form of regression that starts with minimal to no assumptions on what the underlying model that maps the sets of data under study would look like. Even though it can be implemented by Bayesian Methods or Neural Networks, we look at how an implementation with Genetic Algorithms can help customize an expert signal class usable in the MQL5 wizard.
In this article, we will look at the binary genetic algorithm (BGA), which models the natural processes that occur in the genetic material of living things in nature.
In this article, we will explore various methods used in binary genetic and other population algorithms. We will look at the main components of the algorithm, such as selection, crossover and mutation, and their impact on the optimization. In addition, we will study data presentation methods and their impact on optimization results.
Bayesian inference is the adoption of Bayes Theorem to update probability hypothesis as new information is made available. This intuitively leans to adaptation in time series analysis, and so we have a look at how we could use this in building custom classes not just for the signal but also money-management and trailing-stops.
In this article we present the implementation of a feature selection algorithm described in an academic paper titled,"FREL: A stable feature selection algorithm", called Feature weighting as regularized energy based learning.
Neural Architecture Search, an automated approach at determining the ideal neural network settings can be a plus when facing many options and large test data sets. We examine how when paired Eigen Vectors this process can be made even more efficient.
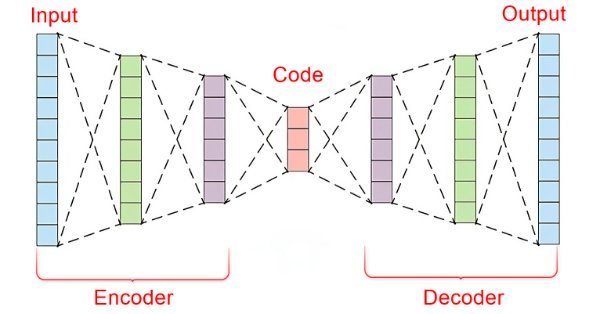
In the fast-paced world of financial markets, separating meaningful signals from the noise is crucial for successful trading. By employing sophisticated neural network architectures, autoencoders excel at uncovering hidden patterns within market data, transforming noisy input into actionable insights. In this article, we explore how autoencoders are revolutionizing trading practices, offering traders a powerful tool to enhance decision-making and gain a competitive edge in today's dynamic markets.
Many people who consider themselves MQL5 programmers do not have the basic knowledge that I will outline in this article. Many people consider MQL5 to be a limited tool, but the actual reason is that they do not have the required knowledge. So, if you don't know something, don't be ashamed of it. It's better to feel ashamed for not asking. Simply forcing MetaTrader 5 to disable indicator duplication in no way ensures two-way communication between the indicator and the Expert Advisor. We are still very far from this, but the fact that the indicator is not duplicated on the chart gives us some confidence.
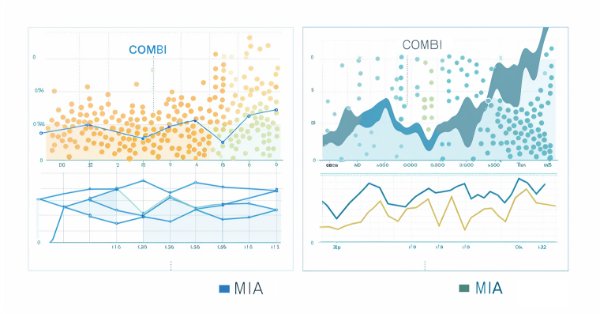
In this article we continue our exploration of the Group Method of Data Handling family of algorithms, with the implementation of the Combinatorial Algorithm along with its refined incarnation, the Combinatorial Selective Algorithm in MQL5.
In this article, we will finally begin to do what we wanted to do much earlier. However, due to the lack of "solid ground", I did not feel confident to present this part publicly. Now I have the basis to do this. I suggest that you focus as much as possible on understanding the content of this article. I mean not simply reading it. I want to emphasize that if you do not understand this article, you can completely give up hope of understanding the content of the following ones.
One of the things that can make our lives as programmers difficult is assumptions. In this article, I will show you how dangerous it is to make assumptions: both in MQL5 programming, where you assume that the type will have a certain value, and in MetaTrader 5, where you assume that different servers work the same.
The article considers an optimization method based on the principles of the body's immune system - Micro Artificial Immune System (Micro-AIS) - a modification of AIS. Micro-AIS uses a simpler model of the immune system and simple immune information processing operations. The article also discusses the advantages and disadvantages of Micro-AIS compared to conventional AIS.
Before we can move forward, we need to fix a few things. These are not actually the necessary fixes but rather improvements to the way the class is managed and used. The reason is that failures occurred due to some interaction within the system. Despite attempts to find out the cause of such failures in order to eliminate them, all these attempts were unsuccessful. Some of these cases make no sense, for example, when we use pointers or recursion in C/C++, the program crashes.
The article presents a new approach to solving optimization problems by combining ideas from bacterial foraging optimization (BFO) algorithms and techniques used in the genetic algorithm (GA) into a hybrid BFO-GA algorithm. It uses bacterial swarming to globally search for an optimal solution and genetic operators to refine local optima. Unlike the original BFO, bacteria can now mutate and inherit genes.
In this article, we will complete the first phase of construction. Although this part is fairly quick to complete, I will cover details that were not discussed previously. I will explain some points that many do not understand. Do you know why you have to press the Shift or Ctrl key?
The article considers a group of optimization algorithms known as Evolution Strategies (ES). They are among the very first population algorithms to use evolutionary principles for finding optimal solutions. We will implement changes to the conventional ES variants and revise the test function and test stand methodology for the algorithms.
ONNX is a great tool for integrating complex AI code between different platforms, it is a great tool that comes with some challenges that one must address to get the most out of it, In this article we discuss the common issues you might face and how to mitigate them.
Today we will continue to develop the order system. As you will see, we will be massively reusing what has already been shown in other articles. Nevertheless, you will receive a small reward in this article. First, we will develop a system that can be used with a real trading server, both from a demo account or from a real one. We will make extensive use of the MetaTrader 5 platform, which will provide us with all the necessary support from the beginning.
Principal Component Analysis, a dimensionality reducing technique in data analysis, is looked at in this article, with how it could be implemented with Eigen values and vectors. As always, we aim to develop a prototype expert-signal-class usable in the MQL5 wizard.
News trading can be complicated and overwhelming, in this article we will go through steps to obtain news data. Additionally we will learn about the MQL5 Economic Calendar and what it has to offer.
The article examines the impact of changing the shape of probability distributions on the performance of optimization algorithms. We will conduct experiments using the Smart Cephalopod (SC) test algorithm to evaluate the efficiency of various probability distributions in the context of optimization problems.
The first part was devoted to the well-known and popular algorithm - simulated annealing. We have thoroughly considered its pros and cons. The second part of the article is devoted to the radical transformation of the algorithm, which turns it into a new optimization algorithm - Simulated Isotropic Annealing (SIA).
The Simulated Annealing algorithm is a metaheuristic inspired by the metal annealing process. In the article, we will conduct a thorough analysis of the algorithm and debunk a number of common beliefs and myths surrounding this widely known optimization method. The second part of the article will consider the custom Simulated Isotropic Annealing (SIA) algorithm.
We will analyze the question of what quantitative analysis is and how it is used by major players. We will create one of the quantitative analysis algorithms in the MQL5 language.
The article presents a complete exploration of the Nelder-Mead method, explaining how the simplex (function parameter space) is modified and rearranged at each iteration to achieve an optimal solution, and describes how the method can be improved.