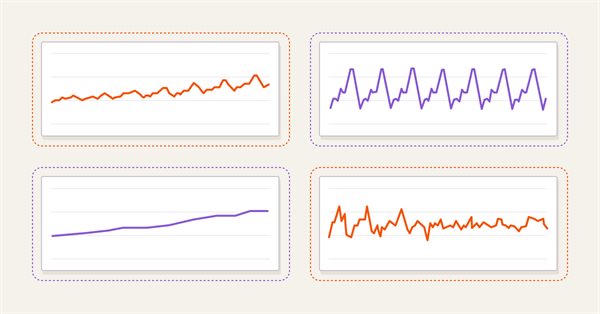
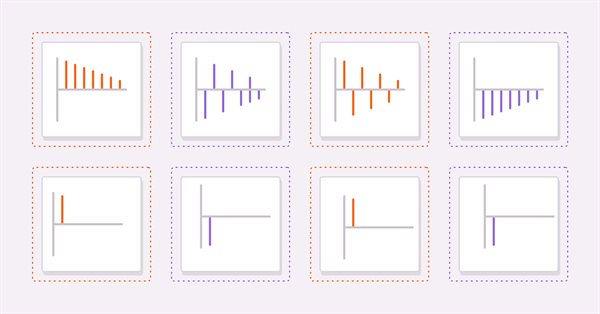
This series of articles introduces several time series labeling methods, which can create data that meets most artificial intelligence models, and targeted data labeling according to needs can make the trained artificial intelligence model more in line with the expected design, improve the accuracy of our model, and even help the model make a qualitative leap!
We continue our look at natural transformations by considering naturality square induction. Slight restraints on multicurrency implementation for experts assembled with the MQL5 wizard mean we are showcasing our data classification abilities with a script. Principle applications considered are price change classification and thus its forecasting.
This series of articles introduces several time series labeling methods, which can create data that meets most artificial intelligence models, and targeted data labeling according to needs can make the trained artificial intelligence model more in line with the expected design, improve the accuracy of our model, and even help the model make a qualitative leap!
This article continues our series into category theory by introducing natural transformations, a key pillar within the subject. We look at the seemingly complex definition, then delve into examples and applications with this series’ ‘bread and butter’; volatility forecasting.
We have managed to develop a way to implement the market replay system in a realistic and accessible way. Now let's continue our project and add data to improve the replay behavior.
In this article, we will fiddle around ChatGPT from OpenAI in order to understand its capabilities in terms of reducing the time and labor intensity of developing Expert Advisors, indicators and scripts. I will quickly navigate you through this technology and try to show you how to use it correctly for programming in MQL4 and MQL5.
This article on Category Theory implementation in MQL5, continues the series by looking at Functors but this time as a bridge between Graphs and a set. We revisit calendar data, and despite its limitations in Strategy Tester use, make the case using functors in forecasting volatility with the help of correlation.
This article, that follows Category Theory implementation of Orders in MQL5, considers how database schemas can be incorporated for classification in MQL5. We take an introductory look at how database schema concepts could be married with category theory when identifying trade relevant text(string) information. Calendar events are the focus.
How about creating a system that would allow us to study the market when it is closed or even to simulate market situations? Here we are going to start a new series of articles in which we will deal with this topic.
This article which is part of a series that follows Category Theory implementation of Graphs in MQL5, delves in Orders. We examine how concepts of Order-Theory can support monoid sets in informing trade decisions by considering two major ordering types.
In this article, we will create a mathematical model for simulating multicurrency pricing and complete the study of the diversification principle as part of the search for mechanisms to increase the trading efficiency, which I started in the previous article with theoretical calculations.
This article is a continuation in a series that look at Category Theory implementation in MQL5. In here we examine how Graph-Theory could be integrated with monoids and other data structures when developing a close-out strategy to a trading system.
In this article, we will use the rebuy algorithm for a deeper understanding of the efficiency of trading systems and start working on the general principles of improving trading efficiency using mathematics and logic, as well as apply the most non-standard methods of increasing efficiency in terms of using absolutely any trading system.
This article continues the series on category theory implementation in MQL5. Here we continue monoid-actions as a means of transforming monoids, covered in the previous article, leading to increased applications.
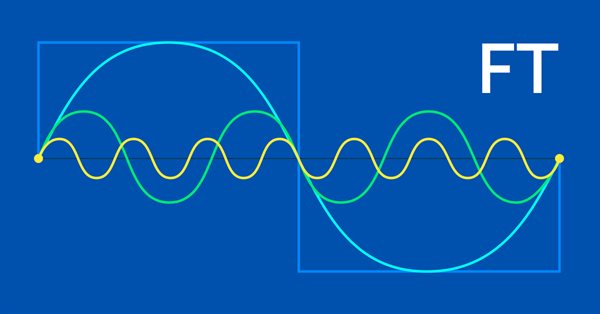
In this article we discuss methods related to the analysis of timeseries in the frequency domain. Emphasizing the utility of examining the power spectra of time series when building predictive models. In this article we will discuss some of the useful perspectives to be gained by analyzing time series in the frequency domain using the discrete fourier transform (dft).
This article continues the series on category theory implementation in MQL5. Here we introduce monoids as domain (set) that sets category theory apart from other data classification methods by including rules and an identity element.
There is an essential need for MQL5 programmers or developers to master important and valuable tools. One of these tools is the Strategy Tester, this article is a practical guide to understanding and using the strategy tester of MQL5.
In this article we will implement an algorithm that applies the Box and Jenkins Autoregressive Integrated Moving Average model by using Powells method of function minimization. Box and Jenkins stated that most time series could be modeled by one or both of two frameworks.
The Fourier transform introduced by Joseph Fourier is a means of deconstructing complex data wave points into simple constituent waves. This feature could be resourceful to traders and this article takes a look at that.
The article describes the principles, methods and possibilities of using the Electromagnetic Algorithm in various optimization problems. The EM algorithm is an efficient optimization tool capable of working with large amounts of data and multidimensional functions.
Category Theory is a diverse and expanding branch of Mathematics which is only recently getting some coverage in the MQL5 community. These series of articles look to explore and examine some of its concepts & axioms with the overall goal of establishing an open library that provides insight while also hopefully furthering the use of this remarkable field in Traders' strategy development.
Saplings Sowing and Growing up (SSG) algorithm is inspired by one of the most resilient organisms on the planet demonstrating outstanding capability for survival in a wide variety of conditions.
In this article, I will consider the Monkey Algorithm (MA) optimization algorithm. The ability of these animals to overcome difficult obstacles and get to the most inaccessible tree tops formed the basis of the idea of the MA algorithm.
In the current article, I will study and test the most powerful optimization algorithm - harmonic search (HS) inspired by the process of finding the perfect sound harmony. So what algorithm is now the leader in our rating?
Category Theory is a diverse and expanding branch of Mathematics which is only recently getting some coverage in the MQL5 community. These series of articles look to explore and examine some of its concepts & axioms with the overall goal of establishing an open library that provides insight while also hopefully furthering the use of this remarkable field in Traders' strategy development.
GSA is a population optimization algorithm inspired by inanimate nature. Thanks to Newton's law of gravity implemented in the algorithm, the high reliability of modeling the interaction of physical bodies allows us to observe the enchanting dance of planetary systems and galactic clusters. In this article, I will consider one of the most interesting and original optimization algorithms. The simulator of the space objects movement is provided as well.
Alan Andrews is one of the most famous "educators" of the modern world in the field of trading. His "pitchfork" is included in almost all modern quote analysis programs. But most traders do not use even a fraction of the opportunities that this tool provides. Besides, Andrews' original training course includes a description not only of the pitchfork (although it remains the main tool), but also of some other useful constructions. The article provides an insight into the marvelous chart analysis methods that Andrews taught in his original course. Beware, there will be a lot of images.
Gary Anderson developed a method of market analysis based on a theory he dubbed the Janus Factor. The theory describes a set of indicators that can be used to reveal trends and assess market risk. In this article we will implement these tools in mql5.
Are you looking for a cutting-edge approach to trading that can help you navigate complex and ever-changing markets? Look no further than Kohonen maps, an innovative form of artificial neural networks that can help you uncover hidden patterns and trends in market data. In this article, we'll explore how Kohonen maps work, and how they can be used to develop smarter, more effective trading strategies. Whether you're a seasoned trader or just starting out, you won't want to miss this exciting new approach to trading.
We continue studying distributed Q-learning algorithms. In previous articles, we have considered distributed and quantile Q-learning algorithms. In the first algorithm, we trained the probabilities of given ranges of values. In the second algorithm, we trained ranges with a given probability. In both of them, we used a priori knowledge of one distribution and trained another one. In this article, we will consider an algorithm which allows the model to train for both distributions.
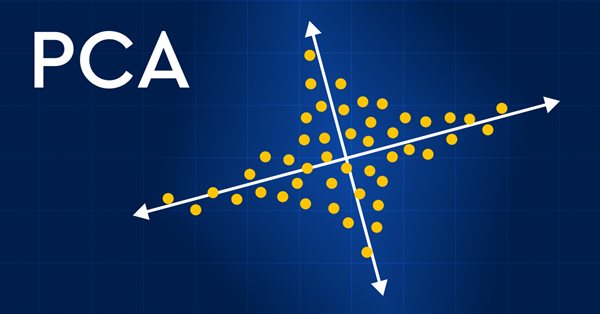
Revolutionize your financial market analysis with Principal Component Analysis (PCA)! Discover how this powerful technique can unlock hidden patterns in your data, uncover latent market trends, and optimize your investment strategies. In this article, we explore how PCA can provide a new lens for analyzing complex financial data, revealing insights that would be missed by traditional approaches. Find out how applying PCA to financial market data can give you a competitive edge and help you stay ahead of the curve
E. coli bacterium foraging strategy inspired scientists to create the BFO optimization algorithm. The algorithm contains original ideas and promising approaches to optimization and is worthy of further study.
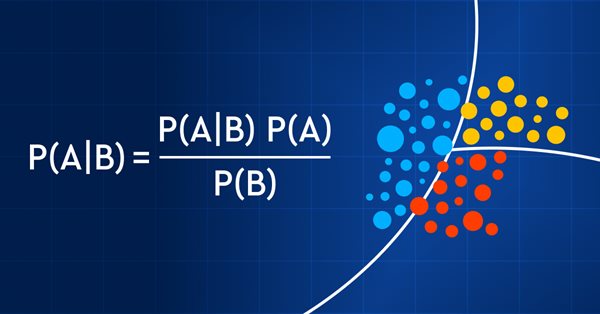
Trading with probability is like walking on a tightrope - it requires precision, balance, and a keen understanding of risk. In the world of trading, the probability is everything. It's the difference between success and failure, profit and loss. By leveraging the power of probability, traders can make informed decisions, manage risk effectively, and achieve their financial goals. So, whether you're a seasoned investor or a novice trader, understanding probability is the key to unlocking your trading potential. In this article, we'll explore the exciting world of trading with probability and show you how to take your trading game to the next level.
Category Theory is a diverse and expanding branch of Mathematics which as of yet is relatively uncovered in the MQL5 community. These series of articles look to introduce and examine some of its concepts with the overall goal of establishing an open library that provides insight while hopefully furthering the use of this remarkable field in Traders' strategy development.