In this article, we introduce functions similar to those provided by the Python-MetaTrader 5 module, providing a simulator with a familiar interface and a custom way of handling bars and ticks internally.
Today we will take a look at my first arbitrage robot — a liquidity provider (if you can call it that) for synthetic assets. Currently, this bot is successfully operating as a module in a large machine learning system, but I pulled up an old Forex arbitrage robot from the cloud, so let's take a look at it and think about what we can do with it today.
How does the market observe Fibonacci-based relationships? This sequence, where each subsequent number is equal to the sum of the two previous ones (1, 1, 2, 3, 5, 8, 13, 21...), not only describes the growth of the rabbit population. We will consider the Pythagorean hypothesis that everything in the world is subject to certain relationships of numbers...
Build a practical MetaTrader 5 “Sigma Score” indicator from scratch and learn what it really measures: The z-score of log returns (how many standard deviations the latest move is from the recent average). The article walks through every code block in OnInit(), OnCalculate(), and OnDeinit(), then shows how to interpret thresholds (e.g., ±2) and apply the Sigma Score as a simple “market stress meter” for mean-reversion and momentum trading.
A new bioinspired optimization metaheuristic, NOA (Neuroboids Optimization Algorithm), combines the principles of collective intelligence and neural networks. Unlike conventional methods, the algorithm uses a population of self-learning "neuroboids", each with its own neural network that adapts its search strategy in real time. The article reveals the architecture of the algorithm, the mechanisms of self-learning of agents, and the prospects for applying this hybrid approach to complex optimization problems.
In this article, we present an MQL5 library for modeling volatility, designed to function similarly to Python's arch package. The library currently supports the specification of common conditional mean (HAR, AR, Constant Mean, Zero Mean) and conditional volatility (Constant Variance, ARCH, GARCH) models.
How about creating something practical using sockets? In today's article, we'll start creating a mini-chat. Let's look together at how this is done - it will be very interesting. Please note that the code provided here is for educational purposes only. It should not be used for commercial purposes or in ready-made applications, as it does not provide data transfer security and the content transmitted over the socket can be accessed.
Successful Restaurateur Algorithm (SRA) is an innovative optimization method inspired by restaurant business management principles. Unlike traditional approaches, SRA does not discard weak solutions, but improves them by combining with elements of successful ones. The algorithm shows competitive results and offers a fresh perspective on balancing exploration and exploitation in optimization problems.
This article shows how to simplify complex MQL5 file operations by building a Python-style interface for effortless reading and writing. It explains how to recreate Python’s intuitive file-handling patterns through custom functions and classes. The result is a cleaner, more reliable approach to MQL5 file I/O.
In this article, we will attempt to predict the market with a decent model for time series forecasting named DeepAR. A model that is a combination of deep neural networks and autoregressive properties found in models like ARIMA and Vector Autoregressive (VAR).
This article proposes another original approach to creating trading systems based on machine learning, using clustering and trade labeling for mean reversion strategies.
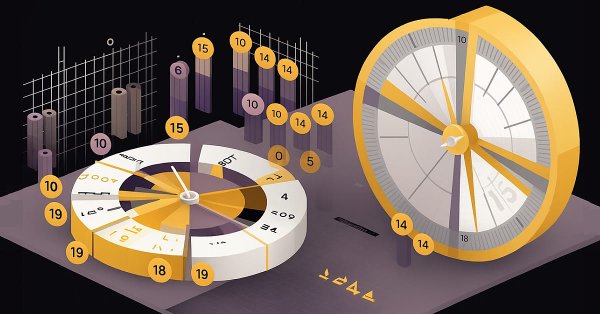
The BOA method is inspired by the classic game of billiards and simulates the search for optimal solutions as a game with balls trying to fall into pockets representing the best results. In this article, we will consider the basics of BOA, its mathematical model, and its efficiency in solving various optimization problems.
In this article, we develop a gauge-style RSI indicator in MQL5 that visualizes Relative Strength Index values on a circular scale with a dynamic needle, color-coded ranges for overbought and oversold levels, and customizable legends. We utilize the Canvas class to draw elements like arcs, ticks, and pies, ensuring smooth updates on new RSI data.
This article describes the use of CSV files for backtesting portfolio weights updates in a mean-reversion-based strategy that uses statistical arbitrage through cointegrated stocks. It goes from feeding the database with the results of a Rolling Windows Eigenvector Comparison (RWEC) to comparing the backtest reports. In the meantime, the article details the role of each RWEC parameter and its impact in the overall backtest result, showing how the comparison of the relative drawdown can help us to further improve those parameters.
In this article, we create a Pivot-Based Trend Indicator in MQL5 that calculates fast and slow pivot lines over user-defined periods, detects trend directions based on price relative to these lines, and signals trend starts with arrows while optionally extending lines beyond the current bar. The indicator supports dynamic visualization with separate up/down lines in customizable colors, dotted fast lines that change color on trend shifts, and optional gradient filling between lines, using a canvas object for enhanced trend-area highlighting.
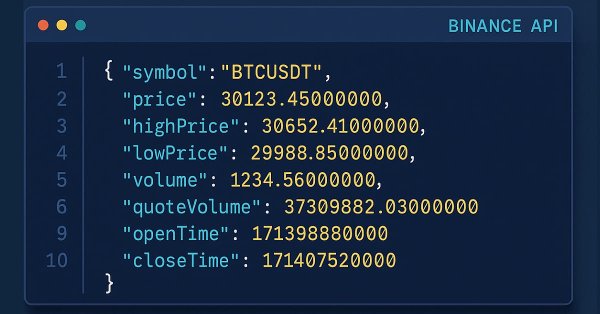
Learn how to use WebRequest and external API calls to retrieve recent candle data, convert each value into a usable type, and save the information neatly in a table format. This step lays the groundwork for building an indicator that visualizes the data in candle format.
The article presents a new metaheuristic algorithm, Chaos Game Optimization (CGO), which demonstrates a unique ability to maintain high efficiency when dealing with high-dimensional problems. Unlike most optimization algorithms, CGO not only does not lose, but sometimes even increases performance when scaling a problem, which is its key feature.
This article proposes using Rolling Windows Eigenvector Comparison for early imbalance diagnostics and portfolio rebalancing in a mean-reversion statistical arbitrage strategy based on cointegrated stocks. It contrasts this technique with traditional In-Sample/Out-of-Sample ADF validation, showing that eigenvector shifts can signal the need for rebalancing even when IS/OOS ADF still indicates a stationary spread. While the method is intended mainly for live trading monitoring, the article concludes that eigenvector comparison could also be integrated into the scoring system—though its actual contribution to performance remains to be tested.
We are going to develop a professional indicator for currency strength analysis in MQL5. This step-by-step guide will show you how to develop a powerful trading tool with a visual dashboard for MetaTrader 5. You will learn how to calculate the strength of currency pairs across multiple timeframes (H1, H4, D1), implement dynamic data updates, and create a user-friendly interface.
Integrating Python's logging module with MQL5 empowers traders with a systematic logging approach, simplifying the process of monitoring, debugging, and documenting trading activities. This article explains the adaptation process, offering traders a powerful tool for maintaining clarity and organization in trading software development.
How can a trader manage capital? How can a trader and investor keep track of expenses, income, assets, and liabilities? I am not just going to introduce you to accounting software; I am going to show you a tool that might become your reliable financial navigator in the stormy sea of trading.
In this article, we develop a Change of Character (CHoCH) detection system in MQL5 that identifies swing highs and lows over a user-defined bar length, labels them as HH/LH for highs or LL/HL for lows to determine trend direction, and triggers trades on breaks of these swing points, indicating a potential reversal, and trades the breaks when the structure changes.
In this article, we implement an adaptive Linear Regression Channel system in MQL5 that automatically calculates the regression line and standard deviation channel over a user-defined period, only activates when the slope exceeds a minimum threshold to confirm a clear trend, and dynamically recreates or extends the channel when the price breaks out by a configurable percentage of channel width.
This article introduces the Pattern Density Heatmap, a price‑action mapping tool that transforms repeated candlestick pattern detections into statistically significant support and resistance zones. Rather than treating each signal in isolation, the EA aggregates detections into fixed price bins, scores their density with optional recency weighting, and confirms levels against higher‑timeframe data. The resulting heatmap reveals where the market has historically reacted—levels that can be used proactively for trade timing, risk management, and strategy confidence across any trading style.
In this article, we look to explore how a complimentary indicator pairing can be used to analyze the recent 5-year history of Vanguard Information Technology Index Fund ETF. By considering two options of algorithms, Kendall’s Tau and Distance-Correlation, we look to select not just an ideal indicator pair for trading the VGT, but also suitable signal-pattern pairings of these two indicators.
Sockets. Do you know what they are for or how to use them in MetaTrader 5? If the answer is no, let's start by studying them. In today's article, we'll cover the basics. Since there are several ways to do the same thing, and we are always interested in the result, I want to show that there is indeed a simple way to transfer data from MetaTrader 5 to other programs, such as Excel. However, the main idea is not to transfer data from MetaTrader 5 to Excel, but the opposite, that is, to transfer data from Excel or any other program to MetaTrader 5.
This article presents the Multi‑Timeframe Visual Analyzer, an MQL5 Expert Advisor that reconstructs and overlays higher‑timeframe candles directly onto your active chart. It explains the implementation, key inputs, and practical outcomes, supported by an animated demo and chart examples showing instant toggling, multi‑timeframe confirmation, and configurable alerts. Read on to see how this tool can make chart analysis faster, clearer, and more efficient.
Unlike MQL5, Python programming language offers control and flexibility when it comes to dealing with and manipulating time. In this article, we will implement similar modules for better handling of dates and time in MQL5 as in Python.
This article is intended for algorithmic traders, quantitative analysts, and MQL5 developers interested in enhancing their understanding of candlestick pattern recognition through practical implementation. It provides an in‑depth exploration of the CandlePatternSearch.mq5 Expert Advisor—a complete framework for detecting, visualizing, and monitoring classical candlestick formations in MetaTrader 5. Beyond a line‑by‑line review of the code, the article discusses architectural design, pattern detection logic, GUI integration, and alert mechanisms, illustrating how traditional price‑action analysis can be automated efficiently.
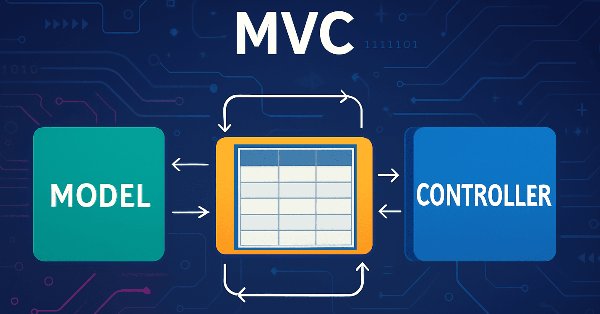
In this article, we look at the process of developing a table model in MQL5 using the MVC (Model-View-Controller) architectural pattern to separate data logic, presentation, and control, enabling structured, flexible, and scalable code. We consider implementation of classes for building a table model, including the use of linked lists for storing data.
Many traders struggle to identify genuine reversals. This article presents an EA that combines RVGI, CCI (±100), and an SMA trend filter to produce a single clear reversal signal. The EA includes an on-chart panel, configurable alerts, and the full source file for immediate download and testing.
Many people, especially non=programmers, find it very difficult to transfer information between MetaTrader 5 and other programs. One such program is Excel. Many use Excel as a way to manage and maintain their risk control. It is an excellent program and easy to learn, even for those who are not VBA programmers. Here we will look at how to establish a connection between MetaTrader 5 and Excel (a very simple method).
In this part, we focus on how to merge real-time market feedback—such as live trade outcomes, volatility changes, and liquidity shifts—with adaptive model learning to maintain a responsive and self-improving trading system.
I present to you my new population optimization algorithm - Blood Inheritance Optimization (BIO), inspired by the human blood group inheritance system. In this algorithm, each solution has its own "blood type" that determines the way it evolves. Just as in nature where a child's blood type is inherited according to specific rules, in BIO new solutions acquire their characteristics through a system of inheritance and mutations.
Just because ticks are constantly flowing in doesn’t mean every moment is an opportunity to trade. Today, we take an in-depth study into the art of timing—focusing on developing a time isolation algorithm to help traders identify and trade within their most favorable market windows. Cultivating this discipline allows retail traders to synchronize more closely with institutional timing, where precision and patience often define success. Join this discussion as we explore the science of timing and selective trading through the analytical capabilities of MQL5.
We will use a quantum computer from IBM to discover all price movement options. Sounds like science fiction? Welcome to the world of quantum computing for trading!
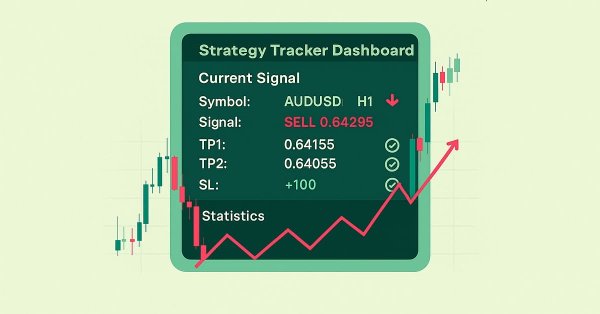
In this article, we develop an MQL5 strategy tracker system that detects moving average crossover signals filtered by a long-term MA, simulates or executes trades with configurable TP levels and SL in points, and monitors outcomes like TP/SL hits for performance analysis.
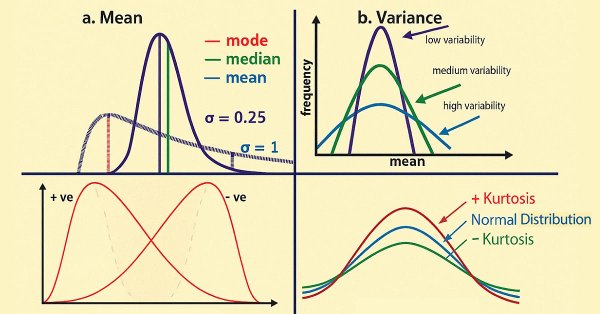
In this article, we develop an MQL5 Expert Advisor for statistical mean reversion trading, calculating moments like mean, variance, skewness, kurtosis, and Jarque-Bera statistics over a specified period to identify non-normal distributions and generate buy/sell signals based on confidence intervals with adaptive thresholds
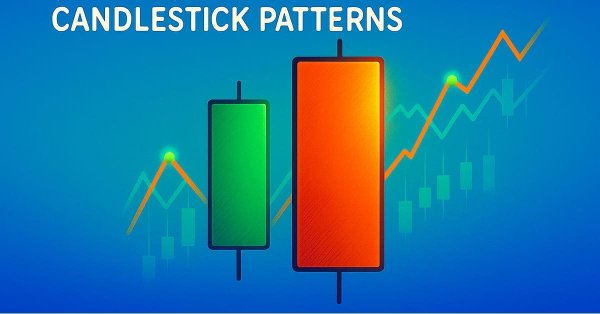
This article helps new community members search for and discover their own candlestick patterns. Describing these patterns can be daunting, as it requires manually searching and creatively identifying improvements. Here, we introduce the engulfing candlestick pattern and show how it can be enhanced for more profitable trading applications.
Every market period has a beginning and an end, each closing with a price that defines its sentiment—much like any candlestick session. Understanding these reference points allows us to gauge the prevailing market mood, revealing whether bullish or bearish forces are in control. In this discussion, we take an important step forward by developing a new feature within the Market Periods Synchronizer—one that visualizes Forex market sessions to support more informed trading decisions. This tool can be especially powerful for identifying, in real time, which side—bulls or bears—dominates the session. Let’s explore this concept and uncover the insights it offers.