Temporal Difference is another algorithm in reinforcement learning that updates Q-Values basing on the difference between predicted and actual rewards during agent training. It specifically dwells on updating Q-Values without minding their state-action pairing. We therefore look to see how to apply this, as we have with previous articles, in a wizard assembled Expert Advisor.
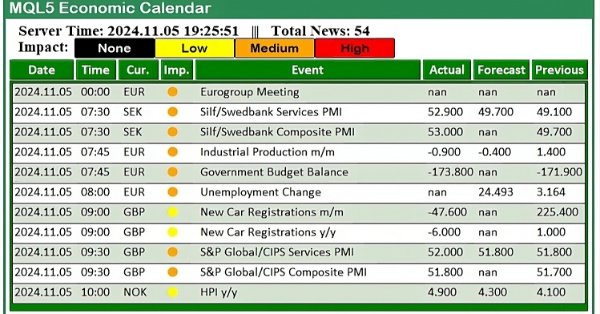
In this article, we create a practical news dashboard panel using the MQL5 Economic Calendar to enhance our trading strategy. We begin by designing the layout, focusing on key elements like event names, importance, and timing, before moving into the setup within MQL5. Finally, we implement a filtering system to display only the most relevant news, giving traders quick access to impactful economic events.
The moving averages and the stochastic oscillator could be used to generate trend following trading signals. However, these signals will only be observed after the price action has occurred. We can effectively overcome this inherent lag in technical indicators using AI. This article will teach you how to create a fully autonomous AI-powered Expert Advisor in a manner that can improve any of your existing trading strategies. Even the oldest trading strategy possible can be improved.
The authors of the FreDF method experimentally confirmed the advantage of combined forecasting in the frequency and time domains. However, the use of the weight hyperparameter is not optimal for non-stationary time series. In this article, we will get acquainted with the method of adaptive combination of forecasts in frequency and time domains.
The Ichimuko Kinko Hyo is a renown Japanese indicator that serves as a trend identification system. We examine this, on a pattern by pattern basis, as has been the case in previous similar articles, and also assess its strategies & test reports with the help of the MQL5 wizard library classes and assembly.
This article will expand on the trade management class to include buy-stop and sell-stop orders to trade news events and implement an expiration constraint on these orders to prevent any overnight trading. A slippage function will be embedded into the expert to try and prevent or minimize possible slippage that may occur when using stop orders in trading, especially during news events.
In this article, we will look into one of the most difficult issues in the field of MQL5 programming: how to correctly obtain a chart ID, and why objects are sometimes not plotted on the chart. The materials presented here are for didactic purposes only. Under no circumstances should the application be viewed for any purpose other than to learn and master the concepts presented.
We continue to explore the analysis and forecasting of time series in the frequency domain. In this article, we will get acquainted with a new method to forecast data in the frequency domain, which can be added to many of the algorithms we have studied previously.
Monte-Carlo is the fourth different algorithm in reinforcement learning that we are considering with the aim of exploring its implementation in wizard assembled Expert Advisors. Though anchored in random sampling, it does present vast ways of simulation which we can look to exploit.
We will solve the chart ID problem and at the same time we will begin to provide the user with the ability to use a personal template for the analysis and simulation of the desired asset. The materials presented here are for didactic purposes only and should in no way be considered as an application for any purpose other than studying and mastering the concepts presented.
In this article, we explore how to use the MQL5 Economic Calendar for trading by first understanding its core functionalities. We then implement key functions of the Economic Calendar in MQL5 to extract relevant news data for trading decisions. Finally, we conclude by showcasing how to utilize this information to enhance trading strategies effectively.
This article will dive into methods to improve the expert's runtime in the strategy tester, the code will be written to divide news event times into hourly categories. These news event times will be accessed within their specified hour. This ensures that the EA can efficiently manage event-driven trades in both high and low-volatility environments.
By studying the FEDformer method, we opened the door to the frequency domain of time series representation. In this new article, we will continue the topic we started. We will consider a method with which we can not only conduct an analysis, but also predict subsequent states in a particular area.
Today, we will discuss enhancing security for the Trading Administrator Panel currently under development. We will explore how to implement MQL5 in a new security strategy, integrating the Telegram API for two-factor authentication (2FA). This discussion will provide valuable insights into the application of MQL5 in reinforcing security measures. Additionally, we will examine the MathRand function, focusing on its functionality and how it can be effectively utilized within our security framework. Continue reading to discover more!
In this article, we'll complicate things a little. Using what was shown in the previous articles, we will start to open up the template file so that the user can use their own template. However, I will be making changes gradually, as I will also be refining the indicator to reduce the load on MetaTrader 5.
All the models we have considered so far analyze the state of the environment as a time sequence. However, the time series can also be represented in the form of frequency features. In this article, I introduce you to an algorithm that uses frequency components of a time sequence to predict future states.
In this article, we focus on transforming our static MQL5 dashboard panel into an interactive tool by enabling button responsiveness. We explore how to automate the functionality of the GUI components, ensuring they react appropriately to user clicks. By the end of the article, we establish a dynamic interface that enhances user engagement and trading experience.
The SMC (Order Block) are key areas where institutional traders initiate significant buying or selling. After a significant price move, fibonacci helps to identify potential retracement from a recent swing high to a swing low to identify optimal trade entry.
In this article, we create an MQL5 Expert Advisor based on the Daily Range Breakout strategy. We cover the strategy’s key concepts, design the EA blueprint, and implement the breakout logic in MQL5. In the end, we explore techniques for backtesting and optimizing the EA to maximize its effectiveness.
SARSA, which is an abbreviation for State-Action-Reward-State-Action is another algorithm that can be used when implementing reinforcement learning. So, as we saw with Q-Learning and DQN, we look into how this could be explored and implemented as an independent model rather than just a training mechanism, in wizard assembled Expert Advisors.
Imagine a malicious actor infiltrating the Trading Administrator room, gaining access to the computers and the Admin Panel used to communicate valuable insights to millions of traders worldwide. Such an intrusion could lead to disastrous consequences, such as the unauthorized sending of misleading messages or random clicks on buttons that trigger unintended actions. In this discussion, we will explore the security measures in MQL5 and the new security features we have implemented in our Admin Panel to safeguard against these threats. By enhancing our security protocols, we aim to protect our communication channels and maintain the trust of our global trading community. Find more insights in this article discussion.
Learn how to develop and implement a comprehensive pending orders EX5 library in your MQL5 code or projects. This article will show you how to create an extensive pending orders management EX5 library and guide you through importing and implementing it by building a trading panel or graphical user interface (GUI). The expert advisor orders panel will allow users to open, monitor, and delete pending orders associated with a specified magic number directly from the graphical interface on the chart window.
Here we are going to develop a script from scratch that simplifies unloading print screens of deals for analyzing trading entries. All the necessary information on a single deal is to be conveniently displayed on one chart with the ability to draw different timeframes.
In this article, we create an interactive trading dashboard using the Controls class in MQL5, designed to streamline trading operations. The panel features a title, navigation buttons for Trade, Close, and Information, and specialized action buttons for executing trades and managing positions. By the end of the article, you will have a foundational panel ready for further enhancements in future installments.
Finally, our Chart Trade indicator starts interacting with the EA, allowing information to be transferred interactively. Therefore, in this article, we will improve the indicator, making it functional enough to be used together with any EA. This will allow us to access the Chart Trade indicator and work with it as if it were actually connected with an EA. But we will do it in a much more interesting way than before.
With the rapid development of artificial intelligence today, language models (LLMs) are an important part of artificial intelligence, so we should think about how to integrate powerful LLMs into our algorithmic trading. For most people, it is difficult to fine-tune these powerful models according to their needs, deploy them locally, and then apply them to algorithmic trading. This series of articles will take a step-by-step approach to achieve this goal.
The ADX is another relatively popular technical indicator used by some traders to gauge the strength of a prevalent trend. Acting as a combination of two other indicators, it presents as an oscillator whose patterns we explore in this article with the help of MQL5 wizard assembly and its support classes.
In this article, we create an Expert Advisor (EA) in MQL5 based on the PIRANHA strategy, utilizing Bollinger Bands to enhance trading effectiveness. We discuss the key principles of the strategy, the coding implementation, and methods for testing and optimization. This knowledge will enable you to deploy the EA in your trading scenarios effectively
In the EA being developed, we already have a certain mechanism for controlling drawdown. But it is probabilistic in nature, as it is based on the results of testing on historical price data. Therefore, the drawdown can sometimes exceed the maximum expected values (although with a small probability). Let's try to add a mechanism that ensures guaranteed compliance with the specified drawdown level.
In this discussion, we will carefully extend the existing Dialog library to incorporate theme management logic. Furthermore, we will integrate methods for theme switching into the CDialog, CEdit, and CButton classes utilized in our Admin Panel project. Continue reading for more insightful perspectives.
The Deep-Q-Network is a reinforcement learning algorithm that engages neural networks in projecting the next Q-value and ideal action during the training process of a machine learning module. We have already considered an alternative reinforcement learning algorithm, Q-Learning. This article therefore presents another example of how an MLP trained with reinforcement learning, can be used within a custom signal class.
To get a good EA, we need to select multiple good sets of parameters of trading strategy instances for it. This can be done manually by running optimization on different symbols and then selecting the best results. But it is better to delegate this work to the program and engage in more productive activities.
The objectives of this article are to prove the necessity of using a risk manager and to implement the principles of controlled risk in algorithmic trading in a separate class, so that everyone can verify the effectiveness of the risk standardization approach in intraday trading and investing in financial markets. In this article, we will create a risk manager class for algorithmic trading. This is a logical continuation of the previous article in which we discussed the creation of a risk manager for manual trading.
In this article, we explore how to integrate Telegram commands with MQL5 to automate the addition of indicators on trading charts. We cover the process of parsing user commands, executing them in MQL5, and testing the system to ensure smooth indicator-based trading
Today, we will explore the possibilities of incorporating multiple strategies into an Expert Advisor (EA) using MQL5. Expert Advisors provide broader capabilities than just indicators and scripts, allowing for more sophisticated trading approaches that can adapt to changing market conditions. Find, more in this article discussion.
Join us as we discuss how you can use AI to optimize your position sizing and order quantities to maximize the returns of your portfolio. We will showcase how to algorithmically identify an optimal portfolio and tailor your portfolio to your returns expectations or risk tolerance levels. In this discussion, we will use the SciPy library and the MQL5 language to create an optimal and diversified portfolio using all the data we have.
In an attempt to obtain the most accurate forecasts, researchers often complicate forecasting models. Which in turn leads to increased model training and maintenance costs. Is such an increase always justified? This article introduces an algorithm that uses the simplicity and speed of linear models and demonstrates results on par with the best models with a more complex architecture.
The Parabolic Stop-and-Reversal (SAR) is an indicator for trend confirmation and trend termination points. Because it is a laggard in identifying trends its primary purpose has been in positioning trailing stop losses on open positions. We, however, explore if indeed it could be used as an Expert Advisor signal, thanks to custom signal classes of wizard assembled Expert Advisors.
This MetaTrader 5 Expert Advisor implements a Scalping OrderFlow strategy with advanced risk management. It uses multiple technical indicators to identify trading opportunities based on order flow imbalances. Backtesting shows potential profitability but highlights the need for further optimization, especially in risk management and trade outcome ratios. Suitable for experienced traders, it requires thorough testing and understanding before live deployment.