In this article, we develop a custom indicator in MQL5 called Smart WaveTrend Crossover, utilizing dual WaveTrend oscillators—one for generating crossover signals and another for trend filtering—with customizable parameters for channel, average, and moving average lengths. The indicator plots colored candles based on the trend direction, displays buy and sell arrow signals on crossovers, and includes options to enable trend confirmation and adjust visual elements like colors and offsets.
In this article, we will explore the innovative Chimera framework: a two-dimensional state-space model that uses neural networks to analyze multivariate time series. This method offers high accuracy with low computational cost, outperforming traditional approaches and Transformer architectures.
Master the automation of Larry Williams’ short-term swing patterns using MQL5. In this guide, we develop a fully configurable Expert Advisor (EA) that leverages non-random market structures. We’ll cover how to integrate robust risk management and flexible exit logic, providing a solid foundation for systematic strategy development and backtesting.
In this article, we enhance the AI-powered trading system in MQL5 with user interface improvements, including loading animations for request preparation and thinking phases, as well as timing metrics displayed in responses for better feedback. We add response management tools like regenerate buttons to re-query the AI and export options to save the last response to a file, streamlining interaction.
Explore whether financial markets are truly random by recreating Larry Williams’ market behavior experiments using MQL5. This article demonstrates how simple price-action tests can reveal statistical market biases using a custom Expert Advisor.
We continue exploring a multi-task learning framework based on ResNeXt, which is characterized by modularity, high computational efficiency, and the ability to identify stable patterns in data. Using a single encoder and specialized "heads" reduces the risk of model overfitting and improves the quality of forecasts.
This article shows how to simplify complex MQL5 file operations by building a Python-style interface for effortless reading and writing. It explains how to recreate Python’s intuitive file-handling patterns through custom functions and classes. The result is a cleaner, more reliable approach to MQL5 file I/O.
In this article, we enhance the gauge-based indicator in MQL5 to support multiple oscillators, allowing user selection through an enumeration for single or combined displays. We introduce sector and round gauge styles via derived classes from a base gauge framework, improving case rendering with arcs, lines, and polygons for a more refined visual appearance.
In this article, we will attempt to predict the market with a decent model for time series forecasting named DeepAR. A model that is a combination of deep neural networks and autoregressive properties found in models like ARIMA and Vector Autoregressive (VAR).
This article proposes another original approach to creating trading systems based on machine learning, using clustering and trade labeling for mean reversion strategies.
The BOA method is inspired by the classic game of billiards and simulates the search for optimal solutions as a game with balls trying to fall into pockets representing the best results. In this article, we will consider the basics of BOA, its mathematical model, and its efficiency in solving various optimization problems.
Learn how to automate Larry Williams market structure concepts in MQL5 by building a complete Expert Advisor that reads swing points, generates trade signals, manages risk, and applies a dynamic trailing stop strategy.
In this article, we develop a gauge-style RSI indicator in MQL5 that visualizes Relative Strength Index values on a circular scale with a dynamic needle, color-coded ranges for overbought and oversold levels, and customizable legends. We utilize the Canvas class to draw elements like arcs, ticks, and pies, ensuring smooth updates on new RSI data.
This article describes the use of CSV files for backtesting portfolio weights updates in a mean-reversion-based strategy that uses statistical arbitrage through cointegrated stocks. It goes from feeding the database with the results of a Rolling Windows Eigenvector Comparison (RWEC) to comparing the backtest reports. In the meantime, the article details the role of each RWEC parameter and its impact in the overall backtest result, showing how the comparison of the relative drawdown can help us to further improve those parameters.
This article will show you how to visualize candle data obtained via the WebRequest function and API in candle format. We'll use MQL5 to read the candle data from a CSV file and display it as custom candles on the chart, since indicators cannot directly use the WebRequest function.
In this article, we enhance the AI-powered trading system's modularity by separating UI components into a dedicated include file. The system now automates trade execution based on AI-generated signals, parsing JSON responses for BUY/SELL/NONE with entry/SL/TP, visualizing patterns like engulfing or divergences on charts with arrows, lines, and labels, and optional auto-signal checks on new bars.
In this article, we build a Liquidity Sweep on Break of Structure (BoS) system in MQL5 that detects swing highs/lows over a user-defined length, labels them as HH/HL/LH/LL to identify BOS (HH in uptrend or LL in downtrend), and spots liquidity sweeps when price wicks beyond the swing but closes back inside on a bullish/bearish candle.
This article explains the design of a prop-firm Expert Advisor for GOLD, featuring breakout filters, multi-timeframe analysis, robust risk management, and strict drawdown protection. The EA helps traders pass prop-firm challenges by avoiding rule breaches and stabilizing trade execution under volatile market conditions.
We continue our look at how MetaTrader can be used outside its forex trading ‘comfort-zone’ by looking at another tradable asset in the form of the FXI ETF. Unlike in the last article where we tried to do ‘too-much’ by delving into not just indicator selection, but also considering indicator pattern combinations, for this article we will swim slightly upstream by focusing more on indicator selection. Our end product for this is intended as a form of pipeline that can help recommend indicators for various assets, provided we have a reasonable amount of their price history.
This topic explores how to build an Adaptive Smart Money Architecture (ASMA)—an intelligent Expert Advisor that merges Smart Money Concepts (Order Blocks, Break of Structure, Fair Value Gaps) with real-time market sentiment to automatically choose the best trading strategy depending on current market conditions.
Self-supervised learning is a powerful paradigm of statistical learning that searches for supervisory signals generated from the observations themselves. This approach reframes challenging unsupervised learning problems into more familiar supervised ones. This technology has overlooked applications for our objective as a community of algorithmic traders. Our discussion, therefore, aims to give the reader an approachable bridge into the open research area of self-supervised learning and offers practical applications that provide robust and reliable statistical models of financial markets without overfitting to small datasets.
In this article, we will look at how to connect a new strategy to the auto optimization system we have created. Let's see what kind of EAs we need to create and whether it will be possible to do without changing the EA library files or minimize the necessary changes.
In this discussion, we introduce a structured, multi-layered defense system designed to pursue aggressive profit targets while minimizing exposure to catastrophic loss. The focus is on blending offensive trading logic with protective safeguards at every level of the trading pipeline. The idea is to engineer an EA that behaves like a “risk-aware predator”—capable of capturing high-value opportunities, but always with layers of insulation that prevent blindness to sudden market stress.
In this article, we create an Inverse Fair Value Gap (IFVG) detection system in MQL5 that identifies bullish/bearish FVGs on recent bars with minimum gap size filtering, tracks their states as normal/mitigated/inverted based on price interactions (mitigation on far-side breaks, retracement on re-entry, inversion on close beyond far side from inside), and ignores overlaps while limiting tracked FVGs.
This article revisits the classic moving average crossover strategy and examines why it often fails in noisy, fast-moving markets. It presents five alternative filtering methods designed to strengthen signal quality and remove weak or unprofitable trades. The discussion highlights how statistical models can learn and correct the errors that human intuition and traditional rules miss. Readers leave with a clearer understanding of how to modernize an outdated strategy and of the pitfalls of relying solely on metrics like RMSE in financial modeling.
This article proposes using Rolling Windows Eigenvector Comparison for early imbalance diagnostics and portfolio rebalancing in a mean-reversion statistical arbitrage strategy based on cointegrated stocks. It contrasts this technique with traditional In-Sample/Out-of-Sample ADF validation, showing that eigenvector shifts can signal the need for rebalancing even when IS/OOS ADF still indicates a stationary spread. While the method is intended mainly for live trading monitoring, the article concludes that eigenvector comparison could also be integrated into the scoring system—though its actual contribution to performance remains to be tested.
We are going to develop a professional indicator for currency strength analysis in MQL5. This step-by-step guide will show you how to develop a powerful trading tool with a visual dashboard for MetaTrader 5. You will learn how to calculate the strength of currency pairs across multiple timeframes (H1, H4, D1), implement dynamic data updates, and create a user-friendly interface.
Integrating Python's logging module with MQL5 empowers traders with a systematic logging approach, simplifying the process of monitoring, debugging, and documenting trading activities. This article explains the adaptation process, offering traders a powerful tool for maintaining clarity and organization in trading software development.
In the world of technical analysis, price often takes center stage. Traders meticulously map out support, resistance, and patterns, yet frequently ignore the critical force that drives these movements: volume. This article delves into a novel approach to volume analysis: the Volume Boundary indicator. This transformation, utilizing sophisticated smoothing functions like the butterfly and triple sine curves, allows for clearer interpretation and the development of systematic trading strategies.
In this article, we develop a Change of Character (CHoCH) detection system in MQL5 that identifies swing highs and lows over a user-defined bar length, labels them as HH/LH for highs or LL/HL for lows to determine trend direction, and triggers trades on breaks of these swing points, indicating a potential reversal, and trades the breaks when the structure changes.
A multi-task learning framework based on ResNeXt optimizes the analysis of financial data, taking into account its high dimensionality, nonlinearity, and time dependencies. The use of group convolution and specialized heads allows the model to effectively extract key features from the input data.
In this session, we will build a sophisticated, multi-signal Expert Advisor using the MQL5 Standard Library. This approach allows us to seamlessly blend built-in signals with our own custom logic, demonstrating how to construct a powerful and flexible trading algorithm. For more, click to read further.
In this article, we implement an adaptive Linear Regression Channel system in MQL5 that automatically calculates the regression line and standard deviation channel over a user-defined period, only activates when the slope exceeds a minimum threshold to confirm a clear trend, and dynamically recreates or extends the channel when the price breaks out by a configurable percentage of channel width.
Today, we use the MQL5 Standard Library to build custom signal classes and let the MQL5 Wizard assemble a professional Expert Advisor for us. This approach simplifies development so that even beginner programmers can create robust EAs without in-depth coding knowledge, focusing instead on tuning inputs and optimizing performance. Join this discussion as we explore the process step by step.
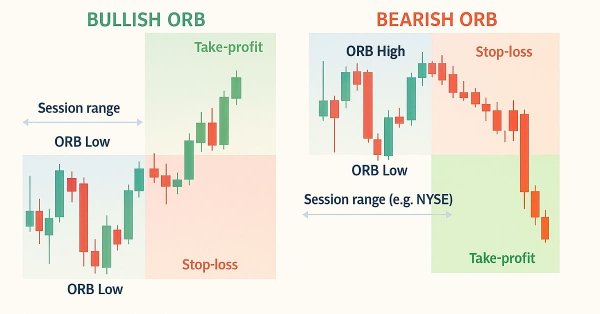
In this article, we create a fully customizable session-based Opening Range Breakout (ORB) system in MQL5 that lets us set any desired session start time and range duration, automatically calculates the high and low of that opening period, and trades only confirmed breakouts in the direction of the move.
Tired of watching progress bars instead of testing trading strategies? Traditional caching fails financial ML, leaving you with lost computations and frustrating restarts. We've engineered a sophisticated caching architecture that understands the unique challenges of financial data—temporal dependencies, complex data structures, and the constant threat of look-ahead bias. Our three-layer system delivers dramatic speed improvements while automatically invalidating stale results and preventing costly data leaks. Stop waiting for computations and start iterating at the pace the markets demand.
We aim to create a system for automatic periodic optimization of trading strategies used in one final EA. As the system evolves, it becomes increasingly complex, so it is necessary to look at it as a whole from time to time in order to identify bottlenecks and suboptimal solutions.
We continue to build the Hidformer hierarchical dual-tower transformer model designed for analyzing and forecasting complex multivariate time series. In this article, we will bring the work we started earlier to its logical conclusion — we will test the model on real historical data.
Unlike MQL5, Python programming language offers control and flexibility when it comes to dealing with and manipulating time. In this article, we will implement similar modules for better handling of dates and time in MQL5 as in Python.
This article shows how to configure a black-box model to automatically uncover strong trading strategies using a data-driven approach. By using Mutual Information to prioritize the most learnable signals, we can build smarter and more adaptive models that outperform conventional methods. Readers will also learn to avoid common pitfalls like overreliance on surface-level metrics, and instead develop strategies rooted in meaningful statistical insight.