Stop-loss is a major tool when it comes to money management in trading. Effective use of stop-loss, take profit and lot size can make a trader more consistent in trading and overall more profitable. Although stop-loss is a great tool, there are challenges that are encountered when being used. The major one being stop-loss hunt. This article looks on how to reduce stop-loss hunt in trade and compare with the classical stop-loss usage to determine its profitability.
The MQL5.com website brings together traders from all over the world. Users publish articles, share free codes, sell products in the Market, perform Freelance orders and copy trading signals. You can communicate with them on the Forum, in trader chats and in MetaTrader channels.
Determing the broker offset and GMT automatically. Instead of asking the support of your broker, from whom you will probably receive an insufficient answer (who would be willing to explain a missing hour), we simply look ourselves how they time their prices in the weeks of the time changes — but not cumbersome by hand, we let a program do it — why do we have a PC after all.
This is the first article in a series related to reversal patterns in the framework of algorithmic trading. We will begin with the most interesting pattern family, which originate from the Double Top and Double Bottom patterns.
This is the must read article for anyone wanting to improve their programming career. This article series is aimed at making you the best programmer you can possibly be, no matter how experienced you are. The discussed ideas work for MQL5 programming newbies as well as professionals.
In this article I will try to expand the classic concept of swap trading methods. I will explain why I have come to the conclusion that this concept deserves special attention and is absolutely recommended for study.
The article provides the description of the technology aimed at increasing the effectiveness of any automated trading system. It provides a brief explanation of the idea, as well as its underlying basics, possibilities and disadvantages.
The article discusses a popular MVC pattern, as well as the possibilities, pros and cons of its usage in MQL programs. The idea is to split an existing code into three separate components: Model, View and Controller.
In the previous article, we started considering methods aimed at improving neural network training quality. In this article, we will continue this topic and will consider another approach — batch data normalization.
The article presents an improved brute force version, based on the goals set in the previous article. I will try to cover this topic as broadly as possible using Expert Advisors with settings obtained using this method. A new program version is attached to this article.
In this article, I will create the signal collection class of the MQL5.com Signals service with the functions for managing signals. Besides, I will improve the Depth of Market snapshot object class for displaying the total DOM buy and sell volumes.
As the next step in studying neural networks, I suggest considering the methods of increasing convergence during neural network training. There are several such methods. In this article we will consider one of them entitled Dropout.
In this article, I will create the collection class of Depths of Market of all symbols and start developing the functionality for working with the MQL5.com Signals service by creating the signal object class.
In this article, I will create two classes (the class of DOM snapshot object and the class of DOM snapshot series object) and test creation of the DOM data series.
This article describes the machine learning technique applied to grid and martingale trading. Surprisingly, this approach has little to no coverage in the global network. After reading the article, you will be able to create your own trading bots.
I continue filling the algorithm with the minimum necessary functionality and testing the results. The profitability is quite low but the articles demonstrate the model of the fully automated profitable trading on completely different instruments traded on fundamentally different markets.
In the article, I will start developing the functionality for working with the Depth of Market. I will also create the class of the Depth of Market abstract order object and its descendants.
Perhaps one of the most advanced models among currently existing language neural networks is GPT-3, the maximal variant of which contains 175 billion parameters. Of course, we are not going to create such a monster on our home PCs. However, we can view which architectural solutions can be used in our work and how we can benefit from them.
In this article, I will implement updating tick data in real time and prepare the symbol object class for working with Depth of Market (DOM itself is to be implemented in the next article).
Since a program may use different symbols in its work, a separate list should be created for each of them. In this article, I will combine such lists into a tick data collection. In fact, this will be a regular list based on the class of dynamic array of pointers to instances of CObject class and its descendants of the Standard library.
It is impossible to get a truly stable algorithm if we use optimization based on historical data to select parameters. A stable algorithm should be aware of what parameters are needed when working on any trading instrument at any time. It should not forecast or guess, it should know for sure.
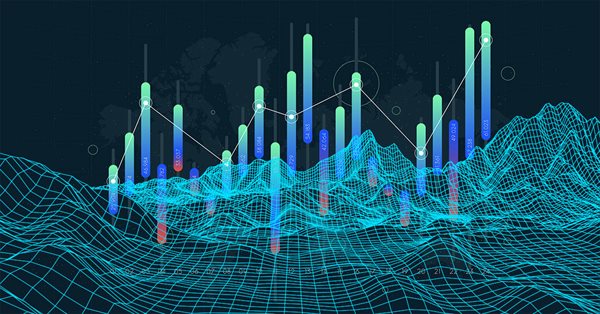
The use of computer vision allows training neural networks on the visual representation of the price chart and indicators. This method enables wider operations with the whole complex of technical indicators, since there is no need to feed them digitally into the neural network.
We have previously considered the mechanism of self-attention in neural networks. In practice, modern neural network architectures use several parallel self-attention threads to find various dependencies between the elements of a sequence. Let us consider the implementation of such an approach and evaluate its impact on the overall network performance.
In this article, I will continue the development of the topic by improving the flexibility of the previously created algorithm. The algorithm became more stable with an increase in the number of candles in the analysis window or with an increase in the threshold percentage of the overweight of falling or growing candles. I had to make a compromise and set a larger sample size for analysis or a larger percentage of the prevailing candle excess.
The article considers the creation of machine learning models with time filters and discusses the effectiveness of this approach. The human factor can be eliminated now by simply instructing the model to trade at a certain hour of a certain day of the week. Pattern search can be provided by a separate algorithm.
In this article, I will try to test the assumption that any system with even a small understanding of the market can operate on a global scale. I will not invent any theories or patterns, but I will only use known facts, gradually translating these facts into the language of mathematical analysis.
In the upcoming series of articles, I will demonstrate the development of self-adapting algorithms considering most market factors, as well as show how to systematize these situations, describe them in logic and take them into account in your trading activity. I will start with a very simple algorithm that will gradually acquire theory and evolve into a very complex project.
From this article on, start creating library functionality to work with price data. Today, create an object class which will store all price data which arrived with yet another tick.
This is the next article within the series, in which I show how I created a convenient library for manual application of chart graphics by utilizing keyboard shortcuts. The tools used include straight lines and their combinations. In this part, we will view how the drawing tools are applied using the functions described in the first part. The library can be connected to any Expert Advisor or indicator which will greatly simplify the charting tasks. This solution DOES NOT use external dlls, while all the commands are implemented using built-in MQL tools.
In previous articles, we used stochastic gradient descent to train a neural network using the same learning rate for all neurons within the network. In this article, I propose to look towards adaptive learning methods which enable changing of the learning rate for each neuron. We will also consider the pros and cons of this approach.
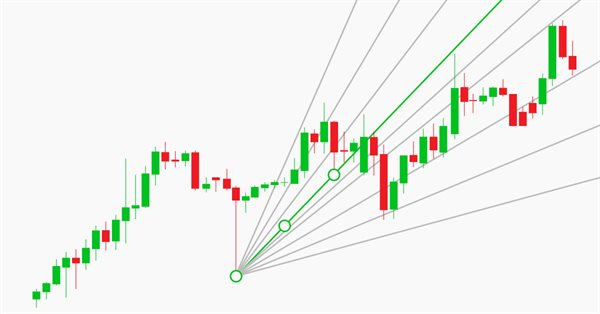
Thomas DeMark Sequential is good at showing balance changes in the price movement. This is especially evident if we combine its signals with a level indicator, for example, Murray levels. The article is intended mostly for beginners and those who still cannot find their "Grail". I will also display some features of building levels that I have not seen on other forums. So, the article will probably be useful for advanced traders as well... Suggestions and reasonable criticism are welcome...
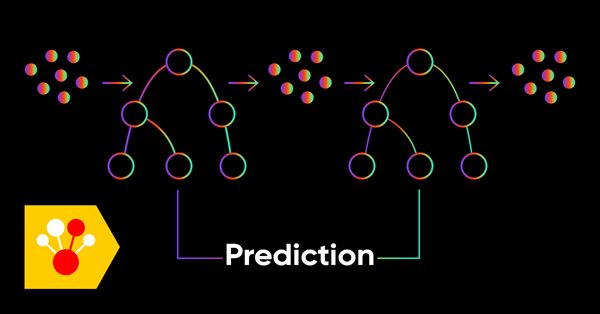
In this article, we will consider active machine learning methods utilizing real data, as well discuss their pros and cons. Perhaps you will find these methods useful and will include them in your arsenal of machine learning models. Transduction was introduced by Vladimir Vapnik, who is the co-inventor of the Support-Vector Machine (SVM).
In this article, I will show the criteria to be used when selecting a system or a signal for investing your funds, as well as describe the optimal approach to the development of trading systems and highlight the importance of this matter in Forex trading.
The article considers creation of the custom indicator object for the use in EAs. Let’s slightly improve library classes and add methods to get data from indicator objects in EAs.
In this article, we will analyze the step-by-step implementation of a trading system based on the programming of deep neural networks in Python. This will be performed using the TensorFlow machine learning library developed by Google. We will also use the Keras library for describing neural networks.
We have earlier discussed some types of neural network implementations. In the considered networks, the same operations are repeated for each neuron. A logical further step is to utilize multithreaded computing capabilities provided by modern technology in an effort to speed up the neural network learning process. One of the possible implementations is described in this article.
The article continues developing indicator object classes and their collections. For each indicator object create its description and correct collection class for error-free storage and getting indicator objects from the collection list.
We continue studying the world of neural networks. In this article, we will consider another type of neural networks, recurrent networks. This type is proposed for use with time series, which are represented in the MetaTrader 5 trading platform by price charts.